
|
Porton Pharma Solutions Ltd. (300363.SZ) Avaliação DCF |
Totalmente Editável: Adapte-Se Às Suas Necessidades No Excel Ou Planilhas
Design Profissional: Modelos Confiáveis E Padrão Da Indústria
Pré-Construídos Para Uso Rápido E Eficiente
Compatível com MAC/PC, totalmente desbloqueado
Não É Necessária Experiência; Fácil De Seguir
Porton Pharma Solutions Ltd. (300363.SZ) Bundle
Procurando avaliar o valor intrínseco da Porton Pharma Solutions Ltd.? Nossa calculadora DCF (300363SZ) integra dados do mundo real com extensos recursos de personalização, permitindo refinar suas previsões e aprimorar suas decisões de investimento.
Discounted Cash Flow (DCF) - (USD MM)
| Year | AY1 2020 |
AY2 2021 |
AY3 2022 |
AY4 2023 |
AY5 2024 |
FY1 2025 |
FY2 2026 |
FY3 2027 |
FY4 2028 |
FY5 2029 |
|---|---|---|---|---|---|---|---|---|---|---|
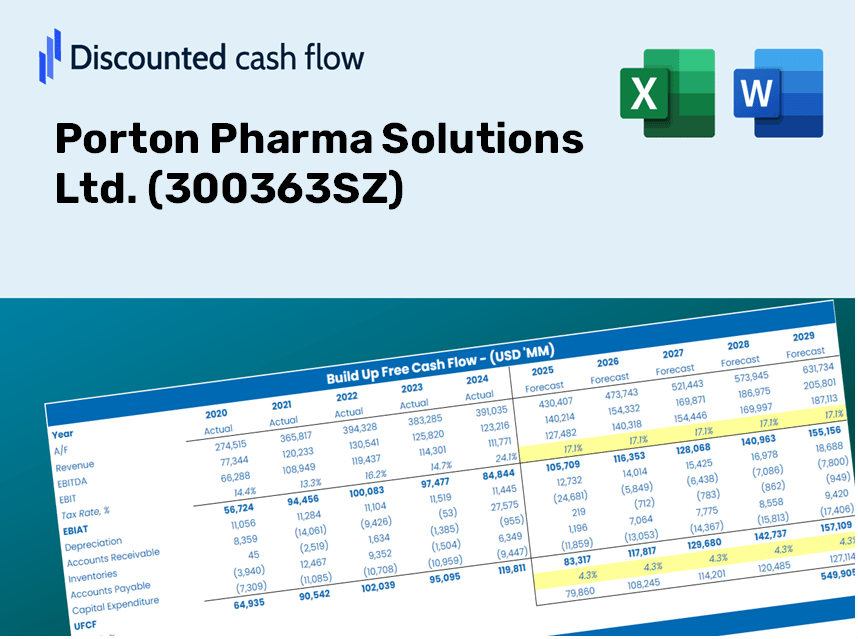
| Revenue | 2,071.9 | 3,105.1 | 7,034.8 | 3,667.4 | 3,012.0 | 2,895.8 | 2,784.0 | 2,676.6 | 2,573.4 | 2,474.1 |
| Revenue Growth, % | 0 | 49.87 | 126.55 | -47.87 | -17.87 | -3.86 | -3.86 | -3.86 | -3.86 | -3.86 |
| EBITDA | 497.8 | 719.9 | 2,452.2 | 580.7 | 95.9 | 585.4 | 562.8 | 541.1 | 520.3 | 500.2 |
| EBITDA, % | 24.03 | 23.18 | 34.86 | 15.83 | 3.18 | 20.22 | 20.22 | 20.22 | 20.22 | 20.22 |
| Depreciation | 131.1 | 164.0 | 234.5 | 288.8 | 319.9 | 193.7 | 186.2 | 179.0 | 172.1 | 165.5 |
| Depreciation, % | 6.33 | 5.28 | 3.33 | 7.87 | 10.62 | 6.69 | 6.69 | 6.69 | 6.69 | 6.69 |
| EBIT | 366.7 | 555.9 | 2,217.6 | 291.9 | -224.0 | 391.8 | 376.7 | 362.1 | 348.2 | 334.7 |
| EBIT, % | 17.7 | 17.9 | 31.52 | 7.96 | -7.44 | 13.53 | 13.53 | 13.53 | 13.53 | 13.53 |
| Total Cash | 1,266.2 | 1,216.9 | 2,850.4 | 1,966.6 | 1,474.5 | 1,409.6 | 1,355.3 | 1,303.0 | 1,252.7 | 1,204.4 |
| Total Cash, percent | .0 | .0 | .0 | .0 | .0 | .0 | .0 | .0 | .0 | .0 |
| Account Receivables | 428.3 | 1,087.7 | 1,506.1 | 735.6 | 865.9 | 729.2 | 701.1 | 674.1 | 648.1 | 623.1 |
| Account Receivables, % | 20.67 | 35.03 | 21.41 | 20.06 | 28.75 | 25.18 | 25.18 | 25.18 | 25.18 | 25.18 |
| Inventories | 429.5 | 757.4 | 902.2 | 717.1 | 771.3 | 597.2 | 574.1 | 552.0 | 530.7 | 510.2 |
| Inventories, % | 20.73 | 24.39 | 12.82 | 19.55 | 25.61 | 20.62 | 20.62 | 20.62 | 20.62 | 20.62 |
| Accounts Payable | 512.6 | 1,111.1 | 1,787.9 | 796.1 | 899.3 | 796.4 | 765.6 | 736.1 | 707.7 | 680.4 |
| Accounts Payable, % | 24.74 | 35.78 | 25.42 | 21.71 | 29.86 | 27.5 | 27.5 | 27.5 | 27.5 | 27.5 |
| Capital Expenditure | -394.0 | -777.0 | -1,173.2 | -1,129.9 | -490.6 | -624.4 | -600.3 | -577.1 | -554.9 | -533.5 |
| Capital Expenditure, % | -19.02 | -25.02 | -16.68 | -30.81 | -16.29 | -21.56 | -21.56 | -21.56 | -21.56 | -21.56 |
| Tax Rate, % | 23.07 | 23.07 | 23.07 | 23.07 | 23.07 | 23.07 | 23.07 | 23.07 | 23.07 | 23.07 |
| EBITAT | 327.0 | 530.6 | 1,980.3 | 315.9 | -172.3 | 353.3 | 339.6 | 326.5 | 313.9 | 301.8 |
| Depreciation | ||||||||||
| Changes in Account Receivables | ||||||||||
| Changes in Inventories | ||||||||||
| Changes in Accounts Payable | ||||||||||
| Capital Expenditure | ||||||||||
| UFCF | -281.0 | -471.2 | 1,155.3 | -561.3 | -424.5 | 130.5 | -54.0 | -51.9 | -49.9 | -48.0 |
| WACC, % | 10.59 | 10.62 | 10.59 | 10.64 | 10.54 | 10.6 | 10.6 | 10.6 | 10.6 | 10.6 |
| PV UFCF | ||||||||||
| SUM PV UFCF | -26.9 | |||||||||
| Long Term Growth Rate, % | 2.00 | |||||||||
| Free cash flow (T + 1) | -49 | |||||||||
| Terminal Value | -569 | |||||||||
| Present Terminal Value | -344 | |||||||||
| Enterprise Value | -371 | |||||||||
| Net Debt | 96 | |||||||||
| Equity Value | -468 | |||||||||
| Diluted Shares Outstanding, MM | 543 | |||||||||
| Equity Value Per Share | -0.86 |
What You Will Receive
- Comprehensive PPM Financials: Provides both historical and projected data for precise valuation of Porton Pharma Solutions Ltd. (300363SZ).
- Customizable Parameters: Adjust variables such as WACC, tax rates, revenue growth, and capital expenditures to suit your analysis.
- Dynamic Calculations: Instantaneous computation of intrinsic value and NPV for informed decision-making.
- Scenario Modeling: Evaluate various scenarios to assess the future outlook of Porton Pharma Solutions Ltd. (300363SZ).
- User-Friendly Interface: Designed for industry experts while remaining easy to navigate for newcomers.
Key Features
- 🔍 Real-Time Porton Pharma Financials: Pre-filled historical and projected data for Porton Pharma Solutions Ltd. (300363SZ).
- ✏️ Fully Customizable Inputs: Modify all essential parameters (yellow cells) such as WACC, growth %, and tax rates.
- 📊 Professional DCF Valuation: Integrated formulas compute Porton Pharma's intrinsic value using the Discounted Cash Flow approach.
- ⚡ Instant Results: View Porton Pharma's valuation immediately after making adjustments.
- Scenario Analysis: Evaluate and compare results for different financial scenarios side-by-side.
How It Works
- Step 1: Download the prebuilt Excel template featuring data for Porton Pharma Solutions Ltd. (300363SZ).
- Step 2: Review the pre-filled sheets to familiarize yourself with the essential metrics.
- Step 3: Adjust forecasts and assumptions in the editable yellow cells (WACC, growth, margins).
- Step 4: Instantly access updated results, including the intrinsic value of Porton Pharma Solutions Ltd. (300363SZ).
- Step 5: Utilize the results to make informed investment choices or create comprehensive reports.
Why Choose This Calculator?
- Reliable Data: Utilize verified Porton Pharma Solutions Ltd. financials for trustworthy valuation outcomes.
- Flexible Options: Tailor essential parameters such as growth rates, WACC, and tax rates according to your forecasts.
- Efficiency Boost: Pre-configured calculations save you time and effort by removing the need to start from the ground up.
- Industry-Standard Tool: Crafted for investors, analysts, and consultants focusing on Porton Pharma Solutions Ltd. (300363SZ).
- Easy to Navigate: User-friendly design and straightforward instructions cater to users of all experience levels.
Who Should Utilize This Product?
- Investors: Accurately assess Porton Pharma Solutions Ltd.'s (300363SZ) fair value before making investment choices.
- CFOs: Utilize a top-tier DCF model for financial reporting and analytical purposes.
- Consultants: Efficiently customize the template for client valuation reports.
- Entrepreneurs: Acquire insights into financial modeling practices employed by leading companies.
- Educators: Employ it as a teaching resource to illustrate valuation techniques.
Contents of the Template
- Pre-Filled Data: Features Porton Pharma Solutions Ltd.’s historical financial performance and projections.
- Discounted Cash Flow Model: An editable DCF valuation model equipped with automatic calculations.
- Weighted Average Cost of Capital (WACC): A dedicated worksheet for WACC calculations, allowing for customized inputs.
- Key Financial Ratios: Examine Porton Pharma Solutions Ltd.’s profitability, efficiency, and financial leverage.
- Customizable Inputs: Easily modify revenue growth rates, margins, and tax assumptions.
- Clear Dashboard: Visual summaries in charts and tables highlighting essential valuation outcomes.
Disclaimer
All information, articles, and product details provided on this website are for general informational and educational purposes only. We do not claim any ownership over, nor do we intend to infringe upon, any trademarks, copyrights, logos, brand names, or other intellectual property mentioned or depicted on this site. Such intellectual property remains the property of its respective owners, and any references here are made solely for identification or informational purposes, without implying any affiliation, endorsement, or partnership.
We make no representations or warranties, express or implied, regarding the accuracy, completeness, or suitability of any content or products presented. Nothing on this website should be construed as legal, tax, investment, financial, medical, or other professional advice. In addition, no part of this site—including articles or product references—constitutes a solicitation, recommendation, endorsement, advertisement, or offer to buy or sell any securities, franchises, or other financial instruments, particularly in jurisdictions where such activity would be unlawful.
All content is of a general nature and may not address the specific circumstances of any individual or entity. It is not a substitute for professional advice or services. Any actions you take based on the information provided here are strictly at your own risk. You accept full responsibility for any decisions or outcomes arising from your use of this website and agree to release us from any liability in connection with your use of, or reliance upon, the content or products found herein.