
|
Wuhan Jingce Electronic Group Co. ، Ltd (300567.SZ) تقييم DCF |
Fully Editable: Tailor To Your Needs In Excel Or Sheets
Professional Design: Trusted, Industry-Standard Templates
Investor-Approved Valuation Models
MAC/PC Compatible, Fully Unlocked
No Expertise Is Needed; Easy To Follow
Wuhan Jingce Electronic Group Co.,Ltd (300567.SZ) Bundle
إتقان تحليل التقييم الخاص بك Wuhan Jingce Electronic Group ، Ltd (300567SZ) باستخدام حاسبة DCF المتطورة! يأتي قالب Excel هذا مسبقًا ببيانات دقيقة (300567SZ) ، مما يتيح لك ضبط التوقعات والافتراضات لتحديد القيمة الجوهرية لشركة Wuhan Jingce Electronic Group ، Ltd بدقة.
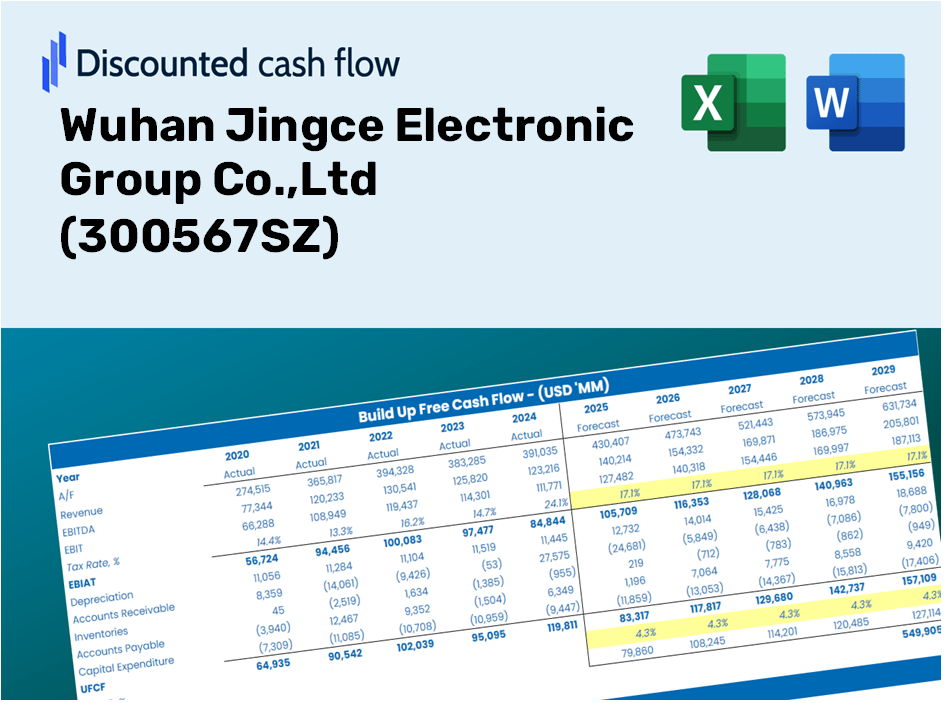
Discounted Cash Flow (DCF) - (USD MM)
| Year | AY1 2020 |
AY2 2021 |
AY3 2022 |
AY4 2023 |
AY5 2024 |
FY1 2025 |
FY2 2026 |
FY3 2027 |
FY4 2028 |
FY5 2029 |
|---|---|---|---|---|---|---|---|---|---|---|
| Revenue | 2,076.5 | 2,409.0 | 2,730.6 | 2,429.4 | 2,565.1 | 2,718.4 | 2,881.0 | 3,053.2 | 3,235.8 | 3,429.2 |
| Revenue Growth, % | 0 | 16.01 | 13.35 | -11.03 | 5.59 | 5.98 | 5.98 | 5.98 | 5.98 | 5.98 |
| EBITDA | 368.8 | 230.6 | 189.3 | 163.1 | -52.7 | 211.7 | 224.3 | 237.7 | 251.9 | 267.0 |
| EBITDA, % | 17.76 | 9.57 | 6.93 | 6.71 | -2.05 | 7.79 | 7.79 | 7.79 | 7.79 | 7.79 |
| Depreciation | 40.7 | 59.6 | 95.0 | 132.5 | 133.5 | 101.0 | 107.0 | 113.4 | 120.2 | 127.4 |
| Depreciation, % | 1.96 | 2.47 | 3.48 | 5.45 | 5.2 | 3.71 | 3.71 | 3.71 | 3.71 | 3.71 |
| EBIT | 328.1 | 171.0 | 94.3 | 30.6 | -186.2 | 110.7 | 117.3 | 124.3 | 131.7 | 139.6 |
| EBIT, % | 15.8 | 7.1 | 3.45 | 1.26 | -7.26 | 4.07 | 4.07 | 4.07 | 4.07 | 4.07 |
| Total Cash | 1,301.1 | 1,474.0 | 940.7 | 1,849.8 | 1,738.8 | 1,643.2 | 1,741.4 | 1,845.5 | 1,955.9 | 2,072.8 |
| Total Cash, percent | .0 | .0 | .0 | .0 | .0 | .0 | .0 | .0 | .0 | .0 |
| Account Receivables | 1,087.5 | 1,199.0 | 1,828.5 | 1,864.5 | 1,648.9 | 1,686.2 | 1,787.0 | 1,893.8 | 2,007.1 | 2,127.1 |
| Account Receivables, % | 52.37 | 49.77 | 66.96 | 76.75 | 64.28 | 62.03 | 62.03 | 62.03 | 62.03 | 62.03 |
| Inventories | 875.2 | 942.9 | 1,354.4 | 1,489.2 | 1,927.5 | 1,453.5 | 1,540.4 | 1,632.5 | 1,730.1 | 1,833.5 |
| Inventories, % | 42.15 | 39.14 | 49.6 | 61.3 | 75.15 | 53.47 | 53.47 | 53.47 | 53.47 | 53.47 |
| Accounts Payable | 852.9 | 665.4 | 1,215.5 | 954.3 | 723.4 | 982.4 | 1,041.1 | 1,103.4 | 1,169.4 | 1,239.3 |
| Accounts Payable, % | 41.07 | 27.62 | 44.52 | 39.28 | 28.2 | 36.14 | 36.14 | 36.14 | 36.14 | 36.14 |
| Capital Expenditure | -362.3 | -616.0 | -825.5 | -515.3 | -427.0 | -604.1 | -640.2 | -678.5 | -719.0 | -762.0 |
| Capital Expenditure, % | -17.45 | -25.57 | -30.23 | -21.21 | -16.65 | -22.22 | -22.22 | -22.22 | -22.22 | -22.22 |
| Tax Rate, % | 54.48 | 54.48 | 54.48 | 54.48 | 54.48 | 54.48 | 54.48 | 54.48 | 54.48 | 54.48 |
| EBITAT | 319.3 | 190.8 | 105.0 | 36.2 | -84.7 | 98.0 | 103.9 | 110.1 | 116.7 | 123.7 |
| Depreciation | ||||||||||
| Changes in Account Receivables | ||||||||||
| Changes in Inventories | ||||||||||
| Changes in Accounts Payable | ||||||||||
| Capital Expenditure | ||||||||||
| UFCF | -1,112.1 | -732.3 | -1,116.3 | -778.6 | -832.0 | 290.7 | -558.3 | -591.6 | -627.0 | -664.5 |
| WACC, % | 5.06 | 5.08 | 5.08 | 5.08 | 4.74 | 5.01 | 5.01 | 5.01 | 5.01 | 5.01 |
| PV UFCF | ||||||||||
| SUM PV UFCF | -1,776.5 | |||||||||
| Long Term Growth Rate, % | 4.00 | |||||||||
| Free cash flow (T + 1) | -691 | |||||||||
| Terminal Value | -68,547 | |||||||||
| Present Terminal Value | -53,688 | |||||||||
| Enterprise Value | -55,464 | |||||||||
| Net Debt | 1,358 | |||||||||
| Equity Value | -56,823 | |||||||||
| Diluted Shares Outstanding, MM | 203 | |||||||||
| Equity Value Per Share | -279.46 |
ماذا ستتلقى
- 300567SZ المالية: الوصول إلى كل من البيانات التاريخية والمتوقعة للتقييم الدقيق.
- مدخلات قابلة للتخصيص: اضبط WACC ومعدلات الضرائب ونمو الإيرادات والنفقات الرأسمالية حسب الحاجة.
- الحسابات في الوقت الحقيقي: الحسابات الديناميكية للقيمة الجوهرية و NPV.
- تحليل السيناريو: استكشف السيناريوهات المختلفة لتقييم الأداء المستقبلي لمجموعة Wuhan Jingce Electronic Group.
- تصميم سهل الاستخدام: تم تصميمه للمهنيين في هذا المجال مع بقاء ودودين للقادمين الجدد.
الميزات الرئيسية
- متغيرات التنبؤ القابلة للتخصيص: اضبط المدخلات الأساسية مثل نمو الإيرادات ، EBITDA ٪ ، والنفقات الرأسمالية المصممة مع شركة Wuhan Jingce Electronic Group ، LTD (300567SZ).
- تقييم DCF الفوري: يحسب بسرعة القيمة الجوهرية ، NPV ، والمخرجات المختلفة الخاصة بسوق [الرمز].
- دقة عالية الدقة: يعزز البيانات المالية الفعلية لـ Wuhan Jingce لنتائج التقييم التي يمكن الاعتماد عليها.
- تحليل سيناريو مبسط: استكشاف الافتراضات المختلفة دون عناء والنتائج المحتملة.
- داعم الكفاءة: يزيل متاعب بناء نماذج التقييم المعقدة من الألف إلى الياء لـ [الرمز].
كيف تعمل
- الخطوة 1: قم بتنزيل ملف Excel.
- الخطوة 2: فحص شركة Wuhan Jingce Electronic Group ، Ltd's (300567SZ) البيانات المالية المملوءة مسبقًا وتوقعاتها.
- الخطوة 3: ضبط المدخلات الرئيسية مثل نمو الإيرادات ، WACC ، ومعدلات الضرائب (الخلايا المميزة).
- الخطوة 4: شاهد طراز DCF تحديث في الوقت الفعلي أثناء تغيير الافتراضات.
- الخطوة 5: راجع المخرجات وتطبيق النتائج على استراتيجيات الاستثمار الخاصة بك.
لماذا تختار هذه الآلة الحاسبة لـ Wuhan Jingce Electronic Group Co. ، Ltd (300567SZ)؟
- مصمم للمهنيين: أداة متقدمة مصممة للمحللين والمديرين الماليين والمستشارين.
- بيانات شاملة: الوصول إلى البيانات المالية التاريخية والمتوقعة لـ Wuhan Jingce جاهزة للتحليل الدقيق.
- تحليل السيناريو المرن: اختبار بسهولة التنبؤات والافتراضات المختلفة لتقييم النتائج المحتملة.
- المخرجات البديهية: يحسب تلقائيًا القيمة الجوهرية ، NPV ، والمقاييس الأساسية الأخرى.
- سهل الاستخدام: يضمن التوجيه الواضحة خطوة بخطوة تجربة سلسة.
من يجب أن يستخدم هذا المنتج؟
- المستثمرون: تقييم بدقة القيمة العادلة لشركة Wuhan Jingce Electronic Group ، Ltd (300567SZ) قبل اتخاذ خيارات الاستثمار.
- المدير المالي: الاستفادة من نموذج DCF من الدرجة المهنية للإبلاغ المالي والتحليل المتعلق بـ [الرمز].
- الاستشاريون: تخصيص القالب لتقارير تقييم العميل بكفاءة ركزت على Wuhan Jingce Electronic Group Co. ، Ltd (300567SZ).
- رواد الأعمال: اكتساب رؤى قيمة في ممارسات النمذجة المالية للشركات الكبرى.
- المعلمون: توظيف هذا المورد كمساعد تعليمي لتوضيح منهجيات التقييم المختلفة.
ما يحتويه القالب
- البيانات التاريخية: يشمل Wuhan Jingce Electronic Group Co. ، Ltd's Ltd Park Distance and Baseline Preportass.
- نماذج DCF و Ruvered DCF: قوالب مفصلة لحساب شركة Wuhan Jingce Electronic Group ، القيمة الجوهرية للمحدودة.
- ورقة WACC: حسابات تم إنشاؤها مسبقًا لمتوسط تكلفة رأس المال المرجح.
- مدخلات قابلة للتحرير: تعديل برامج التشغيل الرئيسية مثل معدلات النمو ، EBITDA ٪ ، وافتراضات Capex.
- البيانات الفصلية والسنوية: انهيار كامل لشركة Wuhan Jingce Electronic Group ، Ltd المالية.
- لوحة القيادة التفاعلية: تصور نتائج التقييم والإسقاطات ديناميكيا.
Disclaimer
All information, articles, and product details provided on this website are for general informational and educational purposes only. We do not claim any ownership over, nor do we intend to infringe upon, any trademarks, copyrights, logos, brand names, or other intellectual property mentioned or depicted on this site. Such intellectual property remains the property of its respective owners, and any references here are made solely for identification or informational purposes, without implying any affiliation, endorsement, or partnership.
We make no representations or warranties, express or implied, regarding the accuracy, completeness, or suitability of any content or products presented. Nothing on this website should be construed as legal, tax, investment, financial, medical, or other professional advice. In addition, no part of this site—including articles or product references—constitutes a solicitation, recommendation, endorsement, advertisement, or offer to buy or sell any securities, franchises, or other financial instruments, particularly in jurisdictions where such activity would be unlawful.
All content is of a general nature and may not address the specific circumstances of any individual or entity. It is not a substitute for professional advice or services. Any actions you take based on the information provided here are strictly at your own risk. You accept full responsibility for any decisions or outcomes arising from your use of this website and agree to release us from any liability in connection with your use of, or reliance upon, the content or products found herein.