
|
Wuhan Jingce Electronic Group Co., Ltd (300567.SZ) DCF Valoración |
Completamente Editable: Adáptelo A Sus Necesidades En Excel O Sheets
Diseño Profesional: Plantillas Confiables Y Estándares De La Industria
Predeterminadas Para Un Uso Rápido Y Eficiente
Compatible con MAC / PC, completamente desbloqueado
No Se Necesita Experiencia; Fáciles De Seguir
Wuhan Jingce Electronic Group Co.,Ltd (300567.SZ) Bundle
¡Domine su análisis de valoración de Wuhan Jingce Electronic Group Co., Ltd (300567SZ) utilizando nuestra sofisticada calculadora DCF! Esta plantilla de Excel viene precisada con datos precisos (300567SZ), lo que le permite ajustar los pronósticos y supuestos para determinar el valor intrínseco de Wuhan Jingce Electronic Group Co., Ltd con precisión.
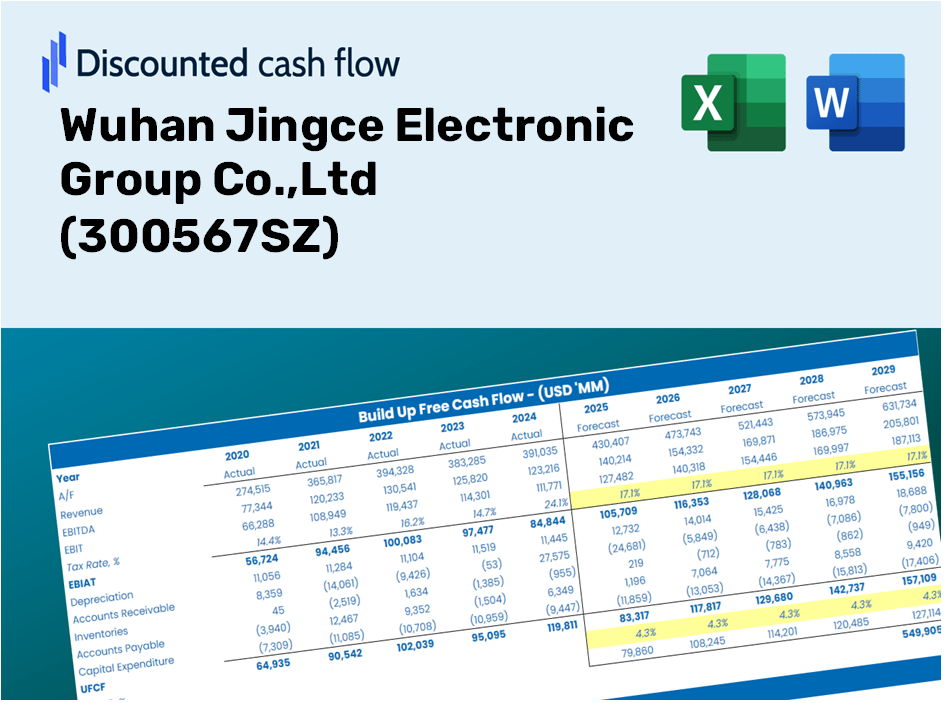
Discounted Cash Flow (DCF) - (USD MM)
| Year | AY1 2020 |
AY2 2021 |
AY3 2022 |
AY4 2023 |
AY5 2024 |
FY1 2025 |
FY2 2026 |
FY3 2027 |
FY4 2028 |
FY5 2029 |
|---|---|---|---|---|---|---|---|---|---|---|
| Revenue | 2,076.5 | 2,409.0 | 2,730.6 | 2,429.4 | 2,565.1 | 2,718.4 | 2,881.0 | 3,053.2 | 3,235.8 | 3,429.2 |
| Revenue Growth, % | 0 | 16.01 | 13.35 | -11.03 | 5.59 | 5.98 | 5.98 | 5.98 | 5.98 | 5.98 |
| EBITDA | 368.8 | 230.6 | 189.3 | 163.1 | -52.7 | 211.7 | 224.3 | 237.7 | 251.9 | 267.0 |
| EBITDA, % | 17.76 | 9.57 | 6.93 | 6.71 | -2.05 | 7.79 | 7.79 | 7.79 | 7.79 | 7.79 |
| Depreciation | 40.7 | 59.6 | 95.0 | 132.5 | 133.5 | 101.0 | 107.0 | 113.4 | 120.2 | 127.4 |
| Depreciation, % | 1.96 | 2.47 | 3.48 | 5.45 | 5.2 | 3.71 | 3.71 | 3.71 | 3.71 | 3.71 |
| EBIT | 328.1 | 171.0 | 94.3 | 30.6 | -186.2 | 110.7 | 117.3 | 124.3 | 131.7 | 139.6 |
| EBIT, % | 15.8 | 7.1 | 3.45 | 1.26 | -7.26 | 4.07 | 4.07 | 4.07 | 4.07 | 4.07 |
| Total Cash | 1,301.1 | 1,474.0 | 940.7 | 1,849.8 | 1,738.8 | 1,643.2 | 1,741.4 | 1,845.5 | 1,955.9 | 2,072.8 |
| Total Cash, percent | .0 | .0 | .0 | .0 | .0 | .0 | .0 | .0 | .0 | .0 |
| Account Receivables | 1,087.5 | 1,199.0 | 1,828.5 | 1,864.5 | 1,648.9 | 1,686.2 | 1,787.0 | 1,893.8 | 2,007.1 | 2,127.1 |
| Account Receivables, % | 52.37 | 49.77 | 66.96 | 76.75 | 64.28 | 62.03 | 62.03 | 62.03 | 62.03 | 62.03 |
| Inventories | 875.2 | 942.9 | 1,354.4 | 1,489.2 | 1,927.5 | 1,453.5 | 1,540.4 | 1,632.5 | 1,730.1 | 1,833.5 |
| Inventories, % | 42.15 | 39.14 | 49.6 | 61.3 | 75.15 | 53.47 | 53.47 | 53.47 | 53.47 | 53.47 |
| Accounts Payable | 852.9 | 665.4 | 1,215.5 | 954.3 | 723.4 | 982.4 | 1,041.1 | 1,103.4 | 1,169.4 | 1,239.3 |
| Accounts Payable, % | 41.07 | 27.62 | 44.52 | 39.28 | 28.2 | 36.14 | 36.14 | 36.14 | 36.14 | 36.14 |
| Capital Expenditure | -362.3 | -616.0 | -825.5 | -515.3 | -427.0 | -604.1 | -640.2 | -678.5 | -719.0 | -762.0 |
| Capital Expenditure, % | -17.45 | -25.57 | -30.23 | -21.21 | -16.65 | -22.22 | -22.22 | -22.22 | -22.22 | -22.22 |
| Tax Rate, % | 54.48 | 54.48 | 54.48 | 54.48 | 54.48 | 54.48 | 54.48 | 54.48 | 54.48 | 54.48 |
| EBITAT | 319.3 | 190.8 | 105.0 | 36.2 | -84.7 | 98.0 | 103.9 | 110.1 | 116.7 | 123.7 |
| Depreciation | ||||||||||
| Changes in Account Receivables | ||||||||||
| Changes in Inventories | ||||||||||
| Changes in Accounts Payable | ||||||||||
| Capital Expenditure | ||||||||||
| UFCF | -1,112.1 | -732.3 | -1,116.3 | -778.6 | -832.0 | 290.7 | -558.3 | -591.6 | -627.0 | -664.5 |
| WACC, % | 5.06 | 5.08 | 5.08 | 5.08 | 4.74 | 5.01 | 5.01 | 5.01 | 5.01 | 5.01 |
| PV UFCF | ||||||||||
| SUM PV UFCF | -1,776.5 | |||||||||
| Long Term Growth Rate, % | 4.00 | |||||||||
| Free cash flow (T + 1) | -691 | |||||||||
| Terminal Value | -68,547 | |||||||||
| Present Terminal Value | -53,688 | |||||||||
| Enterprise Value | -55,464 | |||||||||
| Net Debt | 1,358 | |||||||||
| Equity Value | -56,823 | |||||||||
| Diluted Shares Outstanding, MM | 203 | |||||||||
| Equity Value Per Share | -279.46 |
What You Will Receive
- Genuine 300567SZ Financials: Access to both historical and projected data for precise valuation.
- Customizable Inputs: Adjust WACC, tax rates, revenue growth, and capital expenditures as needed.
- Real-Time Calculations: Dynamic calculations for intrinsic value and NPV.
- Scenario Analysis: Explore various scenarios to assess Wuhan Jingce Electronic Group's future performance.
- User-Friendly Design: Crafted for industry professionals while remaining approachable for newcomers.
Key Features
- Customizable Forecast Variables: Adjust essential inputs such as revenue growth, EBITDA %, and capital expenditures tailored to Wuhan Jingce Electronic Group Co., Ltd (300567SZ).
- Instant DCF Valuation: Quickly computes intrinsic value, NPV, and various outputs specific to the [Symbol] market.
- High-Precision Accuracy: Leverages Wuhan Jingce’s actual financial data for dependable valuation results.
- Simplified Scenario Analysis: Effortlessly explore different assumptions and contrast potential outcomes.
- Efficiency Booster: Removes the hassle of constructing complex valuation models from the ground up for [Symbol].
How It Works
- Step 1: Download the Excel file.
- Step 2: Examine Wuhan Jingce Electronic Group Co., Ltd's (300567SZ) pre-filled financial data and projections.
- Step 3: Adjust key inputs such as revenue growth, WACC, and tax rates (highlighted cells).
- Step 4: Watch the DCF model refresh in real-time as you alter assumptions.
- Step 5: Review the outputs and apply the findings to your investment strategies.
Why Choose This Calculator for Wuhan Jingce Electronic Group Co., Ltd (300567SZ)?
- Designed for Professionals: An advanced tool tailored for analysts, CFOs, and consultants.
- Comprehensive Data: Access to Wuhan Jingce's historical and projected financials ready for precise analysis.
- Flexible Scenario Analysis: Easily test various forecasts and assumptions to evaluate potential outcomes.
- Intuitive Outputs: Automatically computes intrinsic value, NPV, and other essential metrics.
- User-Friendly: Clear, step-by-step guidance ensures a smooth experience.
Who Should Utilize This Product?
- Investors: Accurately assess the fair value of Wuhan Jingce Electronic Group Co., Ltd (300567SZ) before making investment choices.
- CFOs: Utilize a professional-grade DCF model for financial reporting and analysis related to [Symbol].
- Consultants: Efficiently customize the template for client valuation reports focused on Wuhan Jingce Electronic Group Co., Ltd (300567SZ).
- Entrepreneurs: Gain valuable insights into the financial modeling practices of major corporations.
- Educators: Employ this resource as a teaching aid to illustrate various valuation methodologies.
What the Template Contains
- Historical Data: Includes Wuhan Jingce Electronic Group Co., Ltd's past financials and baseline forecasts.
- DCF and Levered DCF Models: Detailed templates to calculate Wuhan Jingce Electronic Group Co., Ltd’s intrinsic value.
- WACC Sheet: Pre-built calculations for Weighted Average Cost of Capital.
- Editable Inputs: Modify key drivers like growth rates, EBITDA %, and CAPEX assumptions.
- Quarterly and Annual Statements: A complete breakdown of Wuhan Jingce Electronic Group Co., Ltd’s financials.
- Interactive Dashboard: Visualize valuation results and projections dynamically.
Disclaimer
All information, articles, and product details provided on this website are for general informational and educational purposes only. We do not claim any ownership over, nor do we intend to infringe upon, any trademarks, copyrights, logos, brand names, or other intellectual property mentioned or depicted on this site. Such intellectual property remains the property of its respective owners, and any references here are made solely for identification or informational purposes, without implying any affiliation, endorsement, or partnership.
We make no representations or warranties, express or implied, regarding the accuracy, completeness, or suitability of any content or products presented. Nothing on this website should be construed as legal, tax, investment, financial, medical, or other professional advice. In addition, no part of this site—including articles or product references—constitutes a solicitation, recommendation, endorsement, advertisement, or offer to buy or sell any securities, franchises, or other financial instruments, particularly in jurisdictions where such activity would be unlawful.
All content is of a general nature and may not address the specific circumstances of any individual or entity. It is not a substitute for professional advice or services. Any actions you take based on the information provided here are strictly at your own risk. You accept full responsibility for any decisions or outcomes arising from your use of this website and agree to release us from any liability in connection with your use of, or reliance upon, the content or products found herein.