
|
شركة Qingdao Tianneng Heavy Industries Co. ، Ltd (300569.SZ) تقييم DCF |
Fully Editable: Tailor To Your Needs In Excel Or Sheets
Professional Design: Trusted, Industry-Standard Templates
Investor-Approved Valuation Models
MAC/PC Compatible, Fully Unlocked
No Expertise Is Needed; Easy To Follow
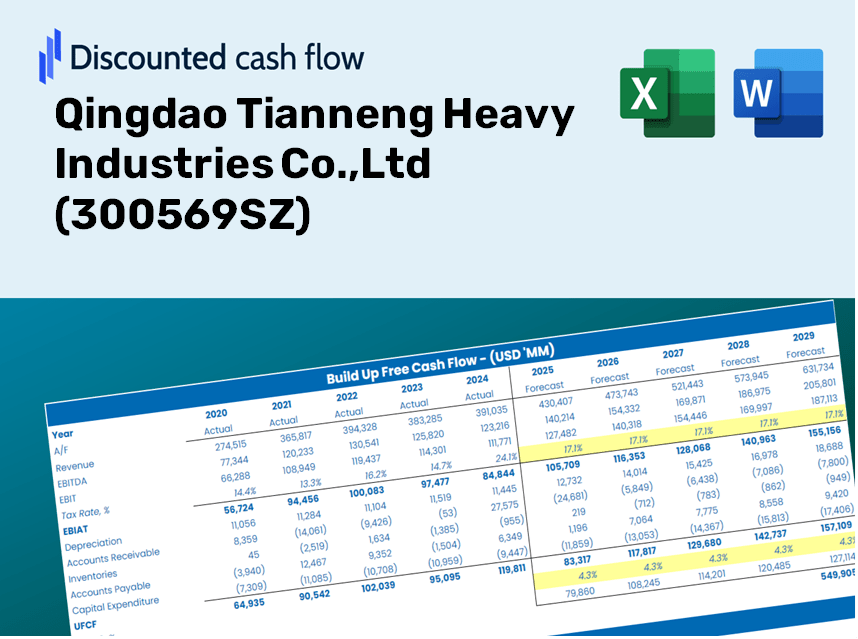
Qingdao Tianneng Heavy Industries Co.,Ltd (300569.SZ) Bundle
تقييم Qingdao Tianneng Heavy Industries Co. ، Ltd التوقعات المالية مثل خبير! توفر لك حاسبة DCF (300569SZ) هذه المالية المملوءة مسبقًا والمرونة لتعديل نمو الإيرادات ، WACC ، الهوامش ، وغيرها من الافتراضات الأساسية التي تتماشى مع توقعاتك.
Discounted Cash Flow (DCF) - (USD MM)
| Year | AY1 2020 |
AY2 2021 |
AY3 2022 |
AY4 2023 |
AY5 2024 |
FY1 2025 |
FY2 2026 |
FY3 2027 |
FY4 2028 |
FY5 2029 |
|---|---|---|---|---|---|---|---|---|---|---|
| Revenue | 3,424.9 | 4,081.0 | 4,182.8 | 4,235.5 | 3,273.0 | 3,274.6 | 3,276.1 | 3,277.7 | 3,279.2 | 3,280.8 |
| Revenue Growth, % | 0 | 19.16 | 2.49 | 1.26 | -22.72 | 0.0470582 | 0.0470582 | 0.0470582 | 0.0470582 | 0.0470582 |
| EBITDA | 799.3 | 908.9 | 693.5 | 742.7 | 262.8 | 574.7 | 575.0 | 575.3 | 575.5 | 575.8 |
| EBITDA, % | 23.34 | 22.27 | 16.58 | 17.54 | 8.03 | 17.55 | 17.55 | 17.55 | 17.55 | 17.55 |
| Depreciation | 113.2 | 192.6 | 237.4 | 284.4 | 336.1 | 200.9 | 201.0 | 201.1 | 201.2 | 201.3 |
| Depreciation, % | 3.3 | 4.72 | 5.68 | 6.71 | 10.27 | 6.14 | 6.14 | 6.14 | 6.14 | 6.14 |
| EBIT | 686.2 | 716.4 | 456.0 | 458.3 | -73.3 | 373.8 | 374.0 | 374.1 | 374.3 | 374.5 |
| EBIT, % | 20.03 | 17.55 | 10.9 | 10.82 | -2.24 | 11.41 | 11.41 | 11.41 | 11.41 | 11.41 |
| Total Cash | 1,006.6 | 1,455.4 | 1,231.6 | 1,260.6 | 972.5 | 1,008.4 | 1,008.9 | 1,009.3 | 1,009.8 | 1,010.3 |
| Total Cash, percent | .0 | .0 | .0 | .0 | .0 | .0 | .0 | .0 | .0 | .0 |
| Account Receivables | 1,842.2 | 2,646.4 | 3,013.0 | 4,238.8 | 3,323.3 | 2,558.6 | 2,559.8 | 2,561.0 | 2,562.2 | 2,563.4 |
| Account Receivables, % | 53.79 | 64.85 | 72.03 | 100.08 | 101.54 | 78.13 | 78.13 | 78.13 | 78.13 | 78.13 |
| Inventories | 593.0 | 1,008.7 | 876.3 | 1,274.4 | 1,565.9 | 922.9 | 923.3 | 923.7 | 924.2 | 924.6 |
| Inventories, % | 17.32 | 24.72 | 20.95 | 30.09 | 47.84 | 28.18 | 28.18 | 28.18 | 28.18 | 28.18 |
| Accounts Payable | 1,398.6 | 2,087.4 | 1,607.3 | 1,949.4 | 1,005.6 | 1,356.7 | 1,357.4 | 1,358.0 | 1,358.7 | 1,359.3 |
| Accounts Payable, % | 40.84 | 51.15 | 38.43 | 46.02 | 30.72 | 41.43 | 41.43 | 41.43 | 41.43 | 41.43 |
| Capital Expenditure | -803.3 | -556.7 | -821.6 | -383.6 | -243.4 | -479.6 | -479.8 | -480.1 | -480.3 | -480.5 |
| Capital Expenditure, % | -23.45 | -13.64 | -19.64 | -9.06 | -7.44 | -14.65 | -14.65 | -14.65 | -14.65 | -14.65 |
| Tax Rate, % | 3.05 | 3.05 | 3.05 | 3.05 | 3.05 | 3.05 | 3.05 | 3.05 | 3.05 | 3.05 |
| EBITAT | 519.1 | 687.6 | 410.6 | 448.0 | -71.1 | 341.2 | 341.3 | 341.5 | 341.6 | 341.8 |
| Depreciation | ||||||||||
| Changes in Account Receivables | ||||||||||
| Changes in Inventories | ||||||||||
| Changes in Accounts Payable | ||||||||||
| Capital Expenditure | ||||||||||
| UFCF | -1,207.7 | -207.6 | -887.8 | -933.2 | -298.1 | 1,821.4 | 61.5 | 61.6 | 61.6 | 61.6 |
| WACC, % | 5.31 | 5.75 | 5.62 | 5.79 | 5.77 | 5.65 | 5.65 | 5.65 | 5.65 | 5.65 |
| PV UFCF | ||||||||||
| SUM PV UFCF | 1,927.7 | |||||||||
| Long Term Growth Rate, % | 4.00 | |||||||||
| Free cash flow (T + 1) | 64 | |||||||||
| Terminal Value | 3,892 | |||||||||
| Present Terminal Value | 2,958 | |||||||||
| Enterprise Value | 4,885 | |||||||||
| Net Debt | 1,578 | |||||||||
| Equity Value | 3,308 | |||||||||
| Diluted Shares Outstanding, MM | 1,022 | |||||||||
| Equity Value Per Share | 3.24 |
ماذا ستتلقى
- البيانات المالية QDTH الحقيقية: تم تحميله مسبقًا مع شركة Qingdao Tianneng Heavy Industries Co. ، Ltd التاريخية والتنبؤات لتحليل دقيق.
- قالب قابل للتخصيص: بسهولة ضبط المدخلات الرئيسية مثل نمو الإيرادات و WACC و EBITDA المئوية.
- الحسابات الفورية: شاهد القيمة الجوهرية لتحديث QDTH في الوقت الفعلي أثناء إجراء تغييرات.
- أداة تقييم الخبراء: مصمم للمستثمرين والمحللين والمستشارين الذين يهدفون إلى نتائج DCF دقيقة.
- تصميم بديهي: بنية مبسطة وإرشادات واضحة مناسبة للمستخدمين من جميع مستويات المهارة.
الميزات الرئيسية
- 🔍 البيانات المالية (300569SZ) المالية: البيانات التاريخية والمتوقعة المليئة مسبقًا لشركة Qingdao Tianneng Heavy Industries Co. ، Ltd.
- ✏️ مدخلات قابلة للتخصيص بالكامل: اضبط جميع المعلمات الأساسية (الخلايا الصفراء) مثل WACC و Growth ٪ ومعدلات الضرائب.
- 📊 تقييم DCF المهني: الصيغ المتكاملة تحسب القيمة الجوهرية لـ (300569SZ) باستخدام طريقة التدفق النقدي المخفض.
- ⚡ النتائج الفورية: تصور تقييم (300569SZ) مباشرة بعد التعديلات.
- تحليل السيناريو: تقييم ومقارنة النتائج للافتراضات المالية المختلفة جنبًا إلى جنب.
كيف تعمل
- تحميل: احصل على ملف Excel الذي تم إعداده مسبقًا يضم بيانات مالية من Qingdao Tianneng Heavy Industries ، Ltd (300569SZ).
- تخصيص: توقعات الخياط مثل نمو الإيرادات ، EBITDA ٪ ، و WACC لتناسب تحليلك.
- التحديث تلقائيًا: استمتع بالتحديثات في الوقت الفعلي للحصول على القيمة الجوهرية وحسابات NPV.
- سيناريوهات الاختبار: تطوير توقعات مختلفة ومقارنة النتائج على الفور.
- اتخاذ القرارات: الاستفادة من رؤى التقييم لإبلاغ استراتيجيات الاستثمار الخاصة بك.
لماذا تختار هذه الآلة الحاسبة؟
- بيانات موثوقة: توفر البيانات المالية الدقيقة من Qingdao Tianneng Heavy Industries (300569SZ) نتائج تقييم جديرة بالثقة.
- خيول: قم بتعديل المعلمات الأساسية مثل معدلات النمو ، و WACC ، ومعدلات الضرائب لتتماشى مع توقعاتك.
- كفاءة: توفر لك العمليات الحسابية المكوّنة مسبقًا جهود البدء من الألف إلى الياء.
- أداة الجودة المهنية: ركزت على المستثمرين والمحللين والمستشارين على (300569SZ).
- سهل الاستخدام: التصميم البديهي والإرشادات الواضحة خطوة بخطوة تجعلها في متناول جميع المستخدمين.
من يمكنه الاستفادة من منتجاتنا؟
- طلاب التمويل: أساليب التقييم الرئيسية وتطبيقها مع بيانات العالم الحقيقي من شركة Qingdao Tianneng Heavy Industries Co. ، Ltd (300569SZ).
- الأكاديميون: عزز المواد التعليمية أو البحث مع النماذج المعيارية للصناعة.
- المستثمرون: التحقق من فرضيات الاستثمار الخاصة بك واستكشاف سيناريوهات التقييم لشركة Qingdao Tianneng Heavy Industries Co. ، Ltd (300569SZ).
- المحللون: قم بتحسين عملية التحليل الخاصة بك مع نموذج DCF مصمم خصيصًا للاستخدام.
- أصحاب الأعمال الصغيرة: اكتشف كيف يتم تقييم الشركات الكبيرة التي يتم تداولها علنًا مثل Qingdao Tianneng Heavy Industries Co. ، Ltd (300569SZ) من قبل المحللين.
محتويات القالب
- البيانات المليئة مسبقا: يضم شركة Qingdao Tianneng Heavy Industries Co. ، Ltd التوقعات والتوقعات التاريخية.
- نموذج التدفق النقدي المخفض: نموذج تقييم DCF قابل للتحرير مع الحسابات الآلية.
- متوسط تكلفة رأس المال المرجح (WACC): ورقة مخصصة لحسابات WACC على أساس المدخلات المعرفة من قبل المستخدم.
- النسب المالية الرئيسية: تقييم مقاييس Qingdao Tianneng والكفاءة والاستفادة من المقاييس.
- مدخلات قابلة للتخصيص: بسهولة تعديل نمو الإيرادات ، هوامش الربح ، ومعدلات الضرائب.
- لوحة معلومات سهلة الاستخدام: التمثيلات المرئية والجداول التي تلخص نتائج التقييم الحرجة.
Disclaimer
All information, articles, and product details provided on this website are for general informational and educational purposes only. We do not claim any ownership over, nor do we intend to infringe upon, any trademarks, copyrights, logos, brand names, or other intellectual property mentioned or depicted on this site. Such intellectual property remains the property of its respective owners, and any references here are made solely for identification or informational purposes, without implying any affiliation, endorsement, or partnership.
We make no representations or warranties, express or implied, regarding the accuracy, completeness, or suitability of any content or products presented. Nothing on this website should be construed as legal, tax, investment, financial, medical, or other professional advice. In addition, no part of this site—including articles or product references—constitutes a solicitation, recommendation, endorsement, advertisement, or offer to buy or sell any securities, franchises, or other financial instruments, particularly in jurisdictions where such activity would be unlawful.
All content is of a general nature and may not address the specific circumstances of any individual or entity. It is not a substitute for professional advice or services. Any actions you take based on the information provided here are strictly at your own risk. You accept full responsibility for any decisions or outcomes arising from your use of this website and agree to release us from any liability in connection with your use of, or reliance upon, the content or products found herein.