
|
Qingdao Tianneng Heavy Industries Co., Ltd (300569.SZ) Évaluation DCF |
Entièrement Modifiable: Adapté À Vos Besoins Dans Excel Ou Sheets
Conception Professionnelle: Modèles Fiables Et Conformes Aux Normes Du Secteur
Pré-Construits Pour Une Utilisation Rapide Et Efficace
Compatible MAC/PC, entièrement débloqué
Aucune Expertise N'Est Requise; Facile À Suivre
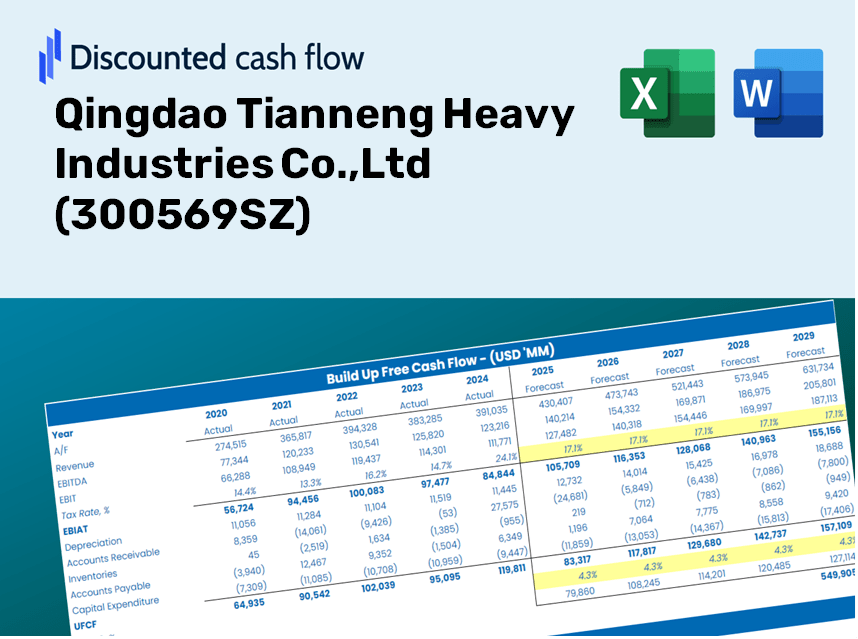
Qingdao Tianneng Heavy Industries Co.,Ltd (300569.SZ) Bundle
Évaluez Qingdao Tianneng Heavy Industries Co., les perspectives financières de Ltd comme un expert! Cette calculatrice DCF (300569SZ) vous offre des finances pré-remplies et la flexibilité de modification de la croissance des revenus, du WACC, des marges et d'autres hypothèses essentielles pour s'aligner sur vos projections.
Discounted Cash Flow (DCF) - (USD MM)
| Year | AY1 2020 |
AY2 2021 |
AY3 2022 |
AY4 2023 |
AY5 2024 |
FY1 2025 |
FY2 2026 |
FY3 2027 |
FY4 2028 |
FY5 2029 |
|---|---|---|---|---|---|---|---|---|---|---|
| Revenue | 3,424.9 | 4,081.0 | 4,182.8 | 4,235.5 | 3,273.0 | 3,274.6 | 3,276.1 | 3,277.7 | 3,279.2 | 3,280.8 |
| Revenue Growth, % | 0 | 19.16 | 2.49 | 1.26 | -22.72 | 0.0470582 | 0.0470582 | 0.0470582 | 0.0470582 | 0.0470582 |
| EBITDA | 799.3 | 908.9 | 693.5 | 742.7 | 262.8 | 574.7 | 575.0 | 575.3 | 575.5 | 575.8 |
| EBITDA, % | 23.34 | 22.27 | 16.58 | 17.54 | 8.03 | 17.55 | 17.55 | 17.55 | 17.55 | 17.55 |
| Depreciation | 113.2 | 192.6 | 237.4 | 284.4 | 336.1 | 200.9 | 201.0 | 201.1 | 201.2 | 201.3 |
| Depreciation, % | 3.3 | 4.72 | 5.68 | 6.71 | 10.27 | 6.14 | 6.14 | 6.14 | 6.14 | 6.14 |
| EBIT | 686.2 | 716.4 | 456.0 | 458.3 | -73.3 | 373.8 | 374.0 | 374.1 | 374.3 | 374.5 |
| EBIT, % | 20.03 | 17.55 | 10.9 | 10.82 | -2.24 | 11.41 | 11.41 | 11.41 | 11.41 | 11.41 |
| Total Cash | 1,006.6 | 1,455.4 | 1,231.6 | 1,260.6 | 972.5 | 1,008.4 | 1,008.9 | 1,009.3 | 1,009.8 | 1,010.3 |
| Total Cash, percent | .0 | .0 | .0 | .0 | .0 | .0 | .0 | .0 | .0 | .0 |
| Account Receivables | 1,842.2 | 2,646.4 | 3,013.0 | 4,238.8 | 3,323.3 | 2,558.6 | 2,559.8 | 2,561.0 | 2,562.2 | 2,563.4 |
| Account Receivables, % | 53.79 | 64.85 | 72.03 | 100.08 | 101.54 | 78.13 | 78.13 | 78.13 | 78.13 | 78.13 |
| Inventories | 593.0 | 1,008.7 | 876.3 | 1,274.4 | 1,565.9 | 922.9 | 923.3 | 923.7 | 924.2 | 924.6 |
| Inventories, % | 17.32 | 24.72 | 20.95 | 30.09 | 47.84 | 28.18 | 28.18 | 28.18 | 28.18 | 28.18 |
| Accounts Payable | 1,398.6 | 2,087.4 | 1,607.3 | 1,949.4 | 1,005.6 | 1,356.7 | 1,357.4 | 1,358.0 | 1,358.7 | 1,359.3 |
| Accounts Payable, % | 40.84 | 51.15 | 38.43 | 46.02 | 30.72 | 41.43 | 41.43 | 41.43 | 41.43 | 41.43 |
| Capital Expenditure | -803.3 | -556.7 | -821.6 | -383.6 | -243.4 | -479.6 | -479.8 | -480.1 | -480.3 | -480.5 |
| Capital Expenditure, % | -23.45 | -13.64 | -19.64 | -9.06 | -7.44 | -14.65 | -14.65 | -14.65 | -14.65 | -14.65 |
| Tax Rate, % | 3.05 | 3.05 | 3.05 | 3.05 | 3.05 | 3.05 | 3.05 | 3.05 | 3.05 | 3.05 |
| EBITAT | 519.1 | 687.6 | 410.6 | 448.0 | -71.1 | 341.2 | 341.3 | 341.5 | 341.6 | 341.8 |
| Depreciation | ||||||||||
| Changes in Account Receivables | ||||||||||
| Changes in Inventories | ||||||||||
| Changes in Accounts Payable | ||||||||||
| Capital Expenditure | ||||||||||
| UFCF | -1,207.7 | -207.6 | -887.8 | -933.2 | -298.1 | 1,821.4 | 61.5 | 61.6 | 61.6 | 61.6 |
| WACC, % | 5.31 | 5.75 | 5.62 | 5.79 | 5.77 | 5.65 | 5.65 | 5.65 | 5.65 | 5.65 |
| PV UFCF | ||||||||||
| SUM PV UFCF | 1,927.7 | |||||||||
| Long Term Growth Rate, % | 4.00 | |||||||||
| Free cash flow (T + 1) | 64 | |||||||||
| Terminal Value | 3,892 | |||||||||
| Present Terminal Value | 2,958 | |||||||||
| Enterprise Value | 4,885 | |||||||||
| Net Debt | 1,578 | |||||||||
| Equity Value | 3,308 | |||||||||
| Diluted Shares Outstanding, MM | 1,022 | |||||||||
| Equity Value Per Share | 3.24 |
What You Will Receive
- Genuine QDTH Financial Data: Pre-loaded with Qingdao Tianneng Heavy Industries Co., Ltd's historical and forecast data for accurate analysis.
- Customizable Template: Easily adjust key inputs such as revenue growth, WACC, and EBITDA percentage.
- Instant Calculations: Watch the intrinsic value of QDTH update in real-time as you make changes.
- Expert Valuation Tool: Tailored for investors, analysts, and consultants aiming for precise DCF outcomes.
- Intuitive Design: Simplified structure and clear guidance suitable for users of all skill levels.
Key Features
- 🔍 Real-Life (300569SZ) Financials: Pre-filled historical and projected data for Qingdao Tianneng Heavy Industries Co., Ltd.
- ✏️ Fully Customizable Inputs: Adjust all essential parameters (yellow cells) such as WACC, growth %, and tax rates.
- 📊 Professional DCF Valuation: Integrated formulas compute the intrinsic value of (300569SZ) using the Discounted Cash Flow method.
- ⚡ Instant Results: Visualize the valuation of (300569SZ) immediately after modifications.
- Scenario Analysis: Evaluate and compare results for different financial assumptions side-by-side.
How It Works
- Download: Obtain the pre-prepared Excel file featuring Qingdao Tianneng Heavy Industries Co., Ltd's (300569SZ) financial data.
- Customize: Tailor forecasts such as revenue growth, EBITDA %, and WACC to suit your analysis.
- Update Automatically: Enjoy real-time updates for intrinsic value and NPV calculations.
- Test Scenarios: Develop various projections and instantly compare the results.
- Make Decisions: Utilize the valuation insights to inform your investment strategies.
Why Opt for This Calculator?
- Reliable Data: Accurate financials from Qingdao Tianneng Heavy Industries (300569SZ) provide trustworthy valuation outcomes.
- Tailorable: Modify essential parameters such as growth rates, WACC, and tax rates to align with your forecasts.
- Efficiency: Pre-configured calculations save you the effort of starting from the ground up.
- Professional-Quality Tool: Crafted for investors, analysts, and consultants focused on (300569SZ).
- Easy to Use: Intuitive design and clear, step-by-step guidance make it accessible for all users.
Who Can Benefit from Our Product?
- Finance Students: Master valuation methods and apply them with real-world data from Qingdao Tianneng Heavy Industries Co., Ltd (300569SZ).
- Academics: Enhance your teaching materials or research with industry-standard models.
- Investors: Validate your investment hypotheses and explore valuation scenarios for Qingdao Tianneng Heavy Industries Co., Ltd (300569SZ).
- Analysts: Optimize your analysis process with a tailored, ready-to-use DCF model.
- Small Business Owners: Discover how large publicly traded companies like Qingdao Tianneng Heavy Industries Co., Ltd (300569SZ) are assessed by analysts.
Contents of the Template
- Pre-Filled Data: Features Qingdao Tianneng Heavy Industries Co., Ltd's historical financials and projections.
- Discounted Cash Flow Model: An editable DCF valuation model with automated calculations.
- Weighted Average Cost of Capital (WACC): A dedicated sheet for WACC calculations based on user-defined inputs.
- Key Financial Ratios: Assess Qingdao Tianneng's profitability, efficiency, and leverage metrics.
- Customizable Inputs: Easily modify revenue growth, profit margins, and tax rates.
- User-Friendly Dashboard: Visual representations and tables summarizing critical valuation outcomes.
Disclaimer
All information, articles, and product details provided on this website are for general informational and educational purposes only. We do not claim any ownership over, nor do we intend to infringe upon, any trademarks, copyrights, logos, brand names, or other intellectual property mentioned or depicted on this site. Such intellectual property remains the property of its respective owners, and any references here are made solely for identification or informational purposes, without implying any affiliation, endorsement, or partnership.
We make no representations or warranties, express or implied, regarding the accuracy, completeness, or suitability of any content or products presented. Nothing on this website should be construed as legal, tax, investment, financial, medical, or other professional advice. In addition, no part of this site—including articles or product references—constitutes a solicitation, recommendation, endorsement, advertisement, or offer to buy or sell any securities, franchises, or other financial instruments, particularly in jurisdictions where such activity would be unlawful.
All content is of a general nature and may not address the specific circumstances of any individual or entity. It is not a substitute for professional advice or services. Any actions you take based on the information provided here are strictly at your own risk. You accept full responsibility for any decisions or outcomes arising from your use of this website and agree to release us from any liability in connection with your use of, or reliance upon, the content or products found herein.