
|
360 One Wam Limited (360ONE.NS) تقييم DCF |
Fully Editable: Tailor To Your Needs In Excel Or Sheets
Professional Design: Trusted, Industry-Standard Templates
Investor-Approved Valuation Models
MAC/PC Compatible, Fully Unlocked
No Expertise Is Needed; Easy To Follow
360 One Wam Limited (360ONE.NS) Bundle
عزز استراتيجيات الاستثمار الخاصة بك مع حاسبة 360 One Wam Limited (360onens) DCF! استكشاف البيانات المالية الأصلية ، وضبط توقعات النمو والنفقات ، ولاحظ على الفور كيفية تأثير التعديلات على القيمة الجوهرية البالغة 360 WAM Limited (360onens).
ما ستتلقاه
- افتراضات التنبؤ القابلة للتعديل: تعديل المدخلات الرئيسية دون عناء (النمو ٪ ، الهوامش ، WACC) لإنشاء مجموعة متنوعة من السيناريوهات.
- بيانات شاملة: المعلومات المالية لـ 360 One Wam Limited (360onens) تم تحميلها مسبقًا لتسريع تحليلك.
- حسابات DCF الآلية: يقوم القالب بحساب القيمة الحالية الصافية (NPV) والقيمة الجوهرية تلقائيًا لراحتك.
- التصميم القابل للتخصيص والمهني: نموذج Excel الأنيق مصمم لتلبية متطلبات التقييم الخاصة بك.
- مصمم للمحللين والمستثمرين: مثالي لتقييم التوقعات ، والتحقق من الاستراتيجيات ، وزيادة الكفاءة.
الميزات الرئيسية
- 🔍 واقعية 360onens المالية: بيانات تاريخية ومتوقعة مسبقًا لـ 360 One Wam Limited.
- ✏️ مدخلات قابلة للتخصيص بالكامل: تعديل جميع المعلمات الأساسية (الخلايا الصفراء) مثل WACC و Growth ٪ ومعدلات الضرائب.
- 📊 تقييم DCF المهني: الصيغ المتكاملة تحسب القيمة الجوهرية لـ 360 One Wam Limited باستخدام طريقة التدفق النقدي المخفض.
- ⚡ النتائج الفورية: عرض تقييم 360 واحد WAM محدودة مباشرة بعد التعديلات.
- تحليل السيناريو: استكشف وقارن النتائج المختلفة بناءً على افتراضات مالية مختلفة جنبًا إلى جنب.
كيف تعمل
- تحميل: احصل على ملف Excel المعبأ مسبقًا يحتوي على 360 بيانات مالية One Wam Limited (360onens).
- تخصيص: تعديل التنبؤات ، مثل نمو الإيرادات ، والنسبة المئوية EBITDA ، و WACC.
- تحديثات الوقت الحقيقي: حسابات القيمة الجوهرية وتحديث NPV تلقائيًا.
- اختبار السيناريو: تطوير توقعات مختلفة ومقارنة النتائج على الفور.
- اتخاذ قرارات مستنيرة: الاستفادة من نتائج التقييم لإبلاغ استراتيجيتك الاستثمارية.
لماذا تختار هذه الآلة الحاسبة لـ 360 One Wam Limited (360onens)؟
- بيانات موثوقة: استخدم البيانات المالية الأصلية لـ 360 One Wam Limited لتحقيق نتائج التقييم التي يمكن الاعتماد عليها.
- قابلة للتخصيص بالكامل: تخصيص المدخلات الأساسية مثل معدلات النمو و WACC ومعدلات الضرائب لتناسب توقعاتك المحددة.
- زيادة الكفاءة: توفر لك الحسابات المدمجة الوقت ، مما يتيح لك تجنب البدء من الصفر.
- أداة عالية الجودة: تم تصميمه لاحتياجات المستثمرين والمحللين والمستشارين.
- تصميم سهل الاستخدام: إن واجهة بديهية وإرشادات واضحة خطوة بخطوة تجعلها في متناول الجميع.
من يمكنه الاستفادة من هذا المنتج؟
- طلاب التمويل: الحصول على مهارات التقييم الأساسية وتطبيقها باستخدام بيانات العالم الحقيقي.
- الأكاديميون: دمج النماذج المتقدمة في مبادرات التدريس أو البحث.
- المستثمرون: التحقق من صحة فرضياتك وتقييم نتائج التقييم لسهم 360 Wam Limited (360onens).
- المحللون: عزز إنتاجيتك من خلال نموذج DCF جاهز وقابل للتخصيص.
- أصحاب الأعمال الصغيرة: فهم الأساليب التحليلية المستخدمة لتقييم الشركات العامة الكبيرة مثل 360 One Wam Limited (360onens).
محتويات القالب
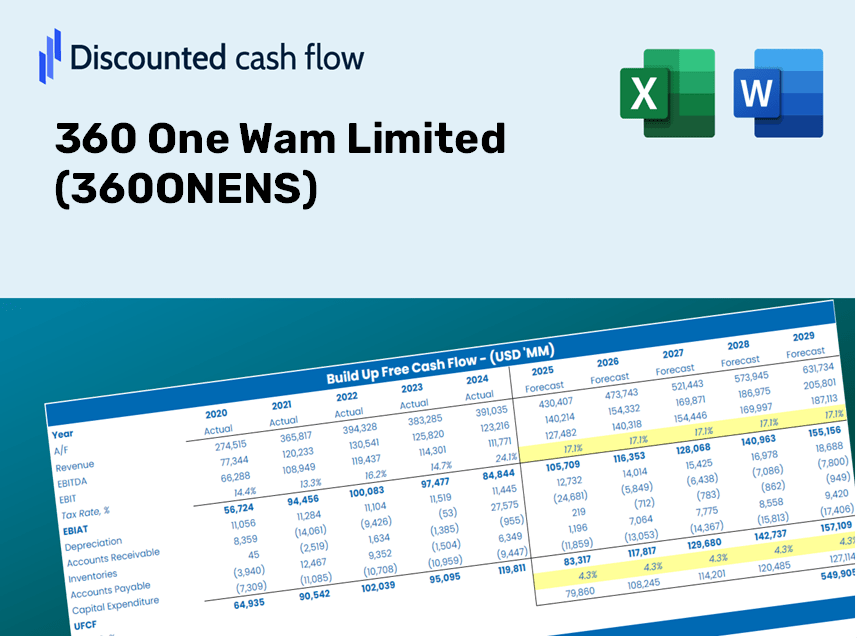
- البيانات التاريخية: تضم 360 One Wam Limited الأداء المالي والتوقعات التأسيسية.
- نماذج DCF و Ruvered DCF: قوالب شاملة لتقييم القيمة الجوهرية لـ 360 One Wam Limited (360onens).
- ورقة WACC: مقاييس محسوبة مسبقًا لمتوسط تكلفة رأس المال المرجح.
- مدخلات قابلة للتحرير: تخصيص العوامل الأساسية مثل معدلات النمو ونسب EBITDA وافتراضات Capex.
- البيانات الفصلية والسنوية: تحليل شامل لـ 360 One Wam Limited.
- لوحة القيادة التفاعلية: تصور ديناميكيا نتائج التقييم والتوقعات.
Disclaimer
All information, articles, and product details provided on this website are for general informational and educational purposes only. We do not claim any ownership over, nor do we intend to infringe upon, any trademarks, copyrights, logos, brand names, or other intellectual property mentioned or depicted on this site. Such intellectual property remains the property of its respective owners, and any references here are made solely for identification or informational purposes, without implying any affiliation, endorsement, or partnership.
We make no representations or warranties, express or implied, regarding the accuracy, completeness, or suitability of any content or products presented. Nothing on this website should be construed as legal, tax, investment, financial, medical, or other professional advice. In addition, no part of this site—including articles or product references—constitutes a solicitation, recommendation, endorsement, advertisement, or offer to buy or sell any securities, franchises, or other financial instruments, particularly in jurisdictions where such activity would be unlawful.
All content is of a general nature and may not address the specific circumstances of any individual or entity. It is not a substitute for professional advice or services. Any actions you take based on the information provided here are strictly at your own risk. You accept full responsibility for any decisions or outcomes arising from your use of this website and agree to release us from any liability in connection with your use of, or reliance upon, the content or products found herein.