
|
360 One WAM Limited (360one.NS) DCF -Bewertung |
Fully Editable: Tailor To Your Needs In Excel Or Sheets
Professional Design: Trusted, Industry-Standard Templates
Investor-Approved Valuation Models
MAC/PC Compatible, Fully Unlocked
No Expertise Is Needed; Easy To Follow
360 One Wam Limited (360ONE.NS) Bundle
Verbessern Sie Ihre Anlagestrategien mit dem 360 One WAM Limited (360onen) DCF -Taschenrechner! Erforschen Sie authentische Finanzdaten, passen Sie Wachstumsprojektionen und -kosten an und beachten Sie sofort, wie sich Veränderungen auf den inneren Wert von 360 One WAM Limited (360onen) auswirken.
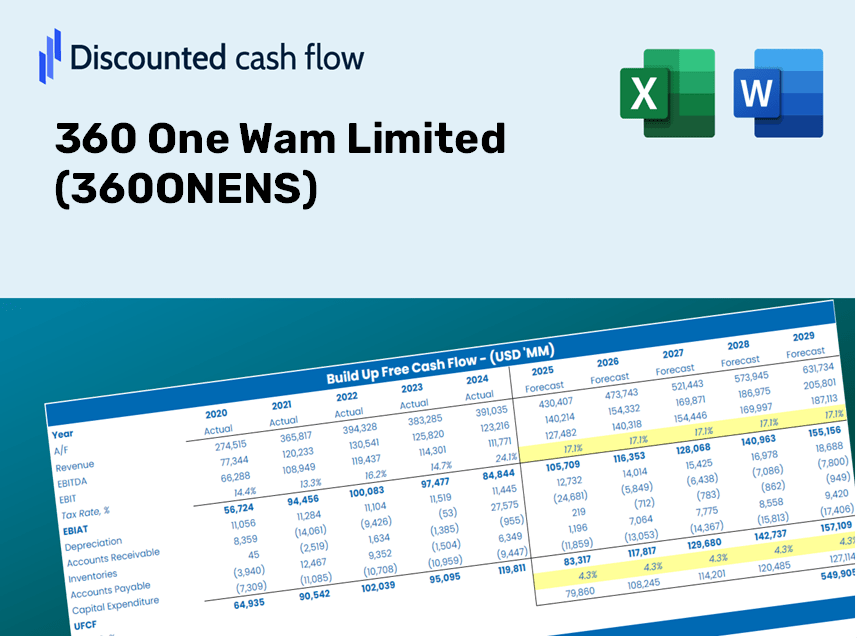
Discounted Cash Flow (DCF) - (USD MM)
| Year | AY1 2021 |
AY2 2022 |
AY3 2023 |
AY4 2024 |
AY5 2025 |
FY1 2026 |
FY2 2027 |
FY3 2028 |
FY4 2029 |
FY5 2030 |
|---|---|---|---|---|---|---|---|---|---|---|
| Revenue | 14,700.2 | 19,510.1 | 21,606.1 | 29,223.0 | 36,843.9 | 46,496.6 | 58,678.1 | 74,051.1 | 93,451.6 | 117,934.8 |
| Revenue Growth, % | 0 | 32.72 | 10.74 | 35.25 | 26.08 | 26.2 | 26.2 | 26.2 | 26.2 | 26.2 |
| EBITDA | 9,467.3 | 11,657.8 | 12,991.6 | 16,995.6 | 23,920.0 | 28,582.9 | 36,071.2 | 45,521.5 | 57,447.6 | 72,498.1 |
| EBITDA, % | 64.4 | 59.75 | 60.13 | 58.16 | 64.92 | 61.47 | 61.47 | 61.47 | 61.47 | 61.47 |
| Depreciation | 429.7 | 417.4 | 463.1 | 566.4 | 705.3 | 1,028.4 | 1,297.8 | 1,637.8 | 2,066.8 | 2,608.3 |
| Depreciation, % | 2.92 | 2.14 | 2.14 | 1.94 | 1.91 | 2.21 | 2.21 | 2.21 | 2.21 | 2.21 |
| EBIT | 9,037.6 | 11,240.4 | 12,528.5 | 16,429.2 | 23,214.7 | 27,554.5 | 34,773.5 | 43,883.7 | 55,380.7 | 69,889.8 |
| EBIT, % | 61.48 | 57.61 | 57.99 | 56.22 | 63.01 | 59.26 | 59.26 | 59.26 | 59.26 | 59.26 |
| Total Cash | 23,773.1 | 43,465.1 | 7,255.6 | 6,381.7 | 10,915.8 | 26,507.4 | 33,452.0 | 42,216.0 | 53,276.1 | 67,233.8 |
| Total Cash, percent | .0 | .0 | .0 | .0 | .0 | .0 | .0 | .0 | .0 | .0 |
| Account Receivables | 3,445.2 | 3,030.7 | 3,525.1 | 3,693.4 | 4,430.6 | 7,434.8 | 9,382.6 | 11,840.8 | 14,942.9 | 18,857.8 |
| Account Receivables, % | 23.44 | 15.53 | 16.32 | 12.64 | 12.03 | 15.99 | 15.99 | 15.99 | 15.99 | 15.99 |
| Inventories | 35,309.5 | 34,076.1 | 49,741.1 | .0 | .0 | 27,897.9 | 35,206.9 | 44,430.7 | 56,071.0 | 70,760.9 |
| Inventories, % | 240.2 | 174.66 | 230.22 | 0 | 0 | 60 | 60 | 60 | 60 | 60 |
| Accounts Payable | 883.4 | 1,762.6 | 1,355.7 | 1,606.3 | 2,026.3 | 3,005.0 | 3,792.3 | 4,785.9 | 6,039.7 | 7,622.0 |
| Accounts Payable, % | 6.01 | 9.03 | 6.27 | 5.5 | 5.5 | 6.46 | 6.46 | 6.46 | 6.46 | 6.46 |
| Capital Expenditure | -252.2 | -163.8 | -706.3 | -1,020.6 | -552.4 | -1,005.8 | -1,269.3 | -1,601.9 | -2,021.5 | -2,551.1 |
| Capital Expenditure, % | -1.72 | -0.83967 | -3.27 | -3.49 | -1.5 | -2.16 | -2.16 | -2.16 | -2.16 | -2.16 |
| Tax Rate, % | 24.62 | 24.62 | 24.62 | 24.62 | 24.62 | 24.62 | 24.62 | 24.62 | 24.62 | 24.62 |
| EBITAT | 6,880.7 | 8,643.7 | 9,694.2 | 13,100.6 | 17,500.4 | 21,246.4 | 26,812.8 | 33,837.4 | 42,702.4 | 53,889.9 |
| Depreciation | ||||||||||
| Changes in Account Receivables | ||||||||||
| Changes in Inventories | ||||||||||
| Changes in Accounts Payable | ||||||||||
| Capital Expenditure | ||||||||||
| UFCF | -30,813.2 | 11,424.5 | -7,115.3 | 62,469.8 | 17,336.1 | -8,654.4 | 18,371.7 | 23,184.9 | 29,259.1 | 36,924.6 |
| WACC, % | 5.44 | 5.45 | 5.46 | 5.5 | 5.43 | 5.45 | 5.45 | 5.45 | 5.45 | 5.45 |
| PV UFCF | ||||||||||
| SUM PV UFCF | 80,056.8 | |||||||||
| Long Term Growth Rate, % | 2.00 | |||||||||
| Free cash flow (T + 1) | 37,663 | |||||||||
| Terminal Value | 1,090,318 | |||||||||
| Present Terminal Value | 836,048 | |||||||||
| Enterprise Value | 916,105 | |||||||||
| Net Debt | 100,686 | |||||||||
| Equity Value | 815,419 | |||||||||
| Diluted Shares Outstanding, MM | 389 | |||||||||
| Equity Value Per Share | 2,094.57 |
What You'll Receive
- Adjustable Forecast Assumptions: Effortlessly modify key inputs (growth %, margins, WACC) to generate a variety of scenarios.
- Comprehensive Data: Financial information for 360 One Wam Limited (360ONENS) pre-loaded to accelerate your analysis.
- Automated DCF Calculations: The template computes Net Present Value (NPV) and intrinsic value automatically for your convenience.
- Customizable and Professional Design: A sleek Excel model tailored to meet your valuation requirements.
- Designed for Analysts and Investors: Perfect for assessing projections, validating strategies, and increasing efficiency.
Key Features
- 🔍 Real-Life 360ONENS Financials: Pre-filled historical and projected data for 360 One Wam Limited.
- ✏️ Fully Customizable Inputs: Modify all essential parameters (yellow cells) such as WACC, growth %, and tax rates.
- 📊 Professional DCF Valuation: Integrated formulas calculate the intrinsic value of 360 One Wam Limited using the Discounted Cash Flow method.
- ⚡ Instant Results: View the valuation of 360 One Wam Limited immediately after adjustments.
- Scenario Analysis: Explore and compare different outcomes based on various financial assumptions side-by-side.
How It Operates
- Download: Obtain the pre-prepared Excel file containing 360 One Wam Limited's (360ONENS) financial data.
- Customize: Modify forecasts, such as revenue growth, EBITDA percentage, and WACC.
- Real-Time Updates: The calculations for intrinsic value and NPV refresh automatically.
- Scenario Testing: Develop various projections and instantly compare results.
- Make Informed Decisions: Leverage the valuation outcomes to inform your investment strategy.
Why Choose This Calculator for 360 One Wam Limited (360ONENS)?
- Reliable Data: Use authentic financials of 360 One Wam Limited to achieve dependable valuation outcomes.
- Fully Customizable: Tailor essential inputs such as growth rates, WACC, and tax rates to fit your specific forecasts.
- Efficiency Boost: Built-in calculations save you time, allowing you to avoid starting from scratch.
- High-Quality Tool: Crafted for the needs of investors, analysts, and consultants.
- User-Friendly Design: An intuitive interface and clear, step-by-step guidance make it accessible to everyone.
Who Can Benefit from This Product?
- Finance Students: Acquire essential valuation skills and apply them using real-world data.
- Academics: Integrate advanced models into your teaching or research initiatives.
- Investors: Validate your hypotheses and evaluate valuation outcomes for 360 One Wam Limited (360ONENS) stock.
- Analysts: Enhance your productivity with a ready-made, customizable DCF model.
- Small Business Owners: Understand the analytical methods used for assessing large public companies like 360 One Wam Limited (360ONENS).
Contents of the Template
- Historical Data: Comprises 360 One Wam Limited's past financial performance and foundational forecasts.
- DCF and Levered DCF Models: Comprehensive templates to assess the intrinsic value of 360 One Wam Limited (360ONENS).
- WACC Sheet: Pre-calculated metrics for the Weighted Average Cost of Capital.
- Editable Inputs: Customize essential factors such as growth rates, EBITDA percentages, and CAPEX assumptions.
- Quarterly and Annual Statements: A thorough analysis of 360 One Wam Limited's financials.
- Interactive Dashboard: Dynamically visualize valuation outcomes and forecasts.
Disclaimer
All information, articles, and product details provided on this website are for general informational and educational purposes only. We do not claim any ownership over, nor do we intend to infringe upon, any trademarks, copyrights, logos, brand names, or other intellectual property mentioned or depicted on this site. Such intellectual property remains the property of its respective owners, and any references here are made solely for identification or informational purposes, without implying any affiliation, endorsement, or partnership.
We make no representations or warranties, express or implied, regarding the accuracy, completeness, or suitability of any content or products presented. Nothing on this website should be construed as legal, tax, investment, financial, medical, or other professional advice. In addition, no part of this site—including articles or product references—constitutes a solicitation, recommendation, endorsement, advertisement, or offer to buy or sell any securities, franchises, or other financial instruments, particularly in jurisdictions where such activity would be unlawful.
All content is of a general nature and may not address the specific circumstances of any individual or entity. It is not a substitute for professional advice or services. Any actions you take based on the information provided here are strictly at your own risk. You accept full responsibility for any decisions or outcomes arising from your use of this website and agree to release us from any liability in connection with your use of, or reliance upon, the content or products found herein.