
|
شركة Shandong Iron and Steel Company Ltd. (600022.ss) تقييم DCF |
Fully Editable: Tailor To Your Needs In Excel Or Sheets
Professional Design: Trusted, Industry-Standard Templates
Investor-Approved Valuation Models
MAC/PC Compatible, Fully Unlocked
No Expertise Is Needed; Easy To Follow
Shandong Iron and Steel Company Ltd. (600022.SS) Bundle
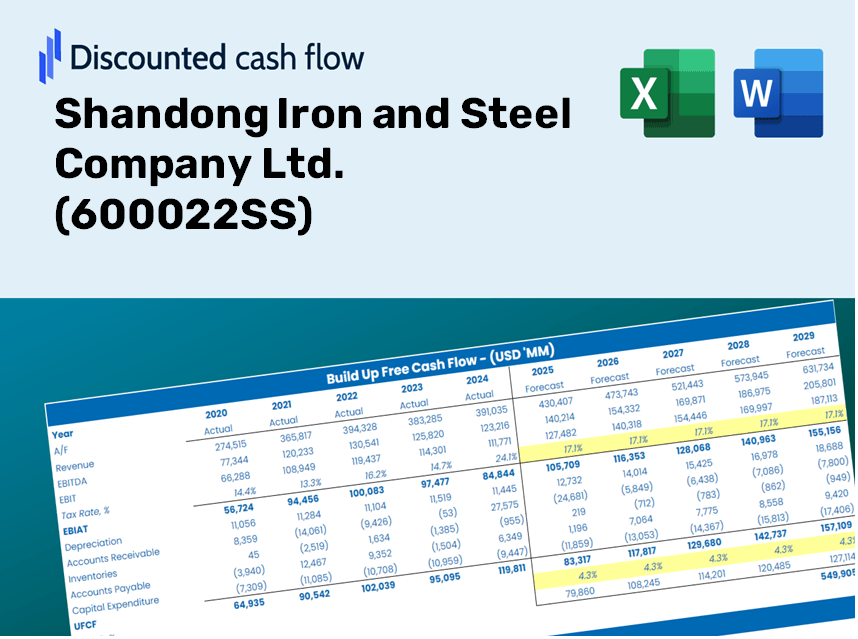
استكشف التوقعات المالية لشركة Shandong Iron and Steel Company Ltd. (600022SS) مع حاسبة DCF سهلة الاستخدام! أدخل توقعاتك للنمو والهوامش والتكاليف لتحديد القيمة الجوهرية لشركة Shandong Iron and Steel Company Ltd. (600022SS) وتعزيز استراتيجية الاستثمار الخاصة بك.
Discounted Cash Flow (DCF) - (USD MM)
| Year | AY1 2020 |
AY2 2021 |
AY3 2022 |
AY4 2023 |
AY5 2024 |
FY1 2025 |
FY2 2026 |
FY3 2027 |
FY4 2028 |
FY5 2029 |
|---|---|---|---|---|---|---|---|---|---|---|
| Revenue | 87,316.7 | 110,850.9 | 102,289.4 | 90,475.1 | 82,094.1 | 85,580.9 | 89,215.8 | 93,005.0 | 96,955.2 | 101,073.2 |
| Revenue Growth, % | 0 | 26.95 | -7.72 | -11.55 | -9.26 | 4.25 | 4.25 | 4.25 | 4.25 | 4.25 |
| EBITDA | 5,181.0 | 6,672.1 | 3,809.8 | 2,263.3 | 53.7 | 3,122.7 | 3,255.3 | 3,393.6 | 3,537.7 | 3,688.0 |
| EBITDA, % | 5.93 | 6.02 | 3.72 | 2.5 | 0.06539941 | 3.65 | 3.65 | 3.65 | 3.65 | 3.65 |
| Depreciation | 2,643.3 | 2,565.1 | 2,357.1 | 2,342.3 | 2,326.2 | 2,236.7 | 2,331.7 | 2,430.8 | 2,534.0 | 2,641.7 |
| Depreciation, % | 3.03 | 2.31 | 2.3 | 2.59 | 2.83 | 2.61 | 2.61 | 2.61 | 2.61 | 2.61 |
| EBIT | 2,537.8 | 4,107.0 | 1,452.7 | -79.0 | -2,272.5 | 885.9 | 923.6 | 962.8 | 1,003.7 | 1,046.3 |
| EBIT, % | 2.91 | 3.7 | 1.42 | -0.08736562 | -2.77 | 1.04 | 1.04 | 1.04 | 1.04 | 1.04 |
| Total Cash | 6,832.1 | 9,833.8 | 7,891.8 | 6,141.5 | 4,864.8 | 6,354.3 | 6,624.2 | 6,905.6 | 7,198.9 | 7,504.6 |
| Total Cash, percent | .0 | .0 | .0 | .0 | .0 | .0 | .0 | .0 | .0 | .0 |
| Account Receivables | 3,940.9 | 2,502.7 | 2,057.6 | 2,717.4 | 1,758.5 | 2,383.9 | 2,485.2 | 2,590.7 | 2,700.8 | 2,815.5 |
| Account Receivables, % | 4.51 | 2.26 | 2.01 | 3 | 2.14 | 2.79 | 2.79 | 2.79 | 2.79 | 2.79 |
| Inventories | 5,082.9 | 6,110.8 | 4,983.2 | 4,814.1 | 5,264.0 | 4,782.0 | 4,985.1 | 5,196.9 | 5,417.6 | 5,647.7 |
| Inventories, % | 5.82 | 5.51 | 4.87 | 5.32 | 6.41 | 5.59 | 5.59 | 5.59 | 5.59 | 5.59 |
| Accounts Payable | 16,847.4 | 18,017.7 | 17,407.6 | 18,519.3 | 6,841.0 | 13,927.2 | 14,518.7 | 15,135.4 | 15,778.2 | 16,448.4 |
| Accounts Payable, % | 19.29 | 16.25 | 17.02 | 20.47 | 8.33 | 16.27 | 16.27 | 16.27 | 16.27 | 16.27 |
| Capital Expenditure | -2,155.0 | -2,433.4 | -1,938.7 | -697.4 | -340.6 | -1,325.5 | -1,381.8 | -1,440.5 | -1,501.7 | -1,565.5 |
| Capital Expenditure, % | -2.47 | -2.2 | -1.9 | -0.77079 | -0.41493 | -1.55 | -1.55 | -1.55 | -1.55 | -1.55 |
| Tax Rate, % | 9.95 | 9.95 | 9.95 | 9.95 | 9.95 | 9.95 | 9.95 | 9.95 | 9.95 | 9.95 |
| EBITAT | 930.5 | 1,250.5 | 534.0 | -321.6 | -2,046.3 | 520.8 | 542.9 | 566.0 | 590.0 | 615.1 |
| Depreciation | ||||||||||
| Changes in Account Receivables | ||||||||||
| Changes in Inventories | ||||||||||
| Changes in Accounts Payable | ||||||||||
| Capital Expenditure | ||||||||||
| UFCF | 9,242.4 | 2,962.9 | 1,914.9 | 1,944.4 | -11,230.1 | 8,374.7 | 1,780.0 | 1,855.6 | 1,934.4 | 2,016.6 |
| WACC, % | 3.11 | 2.97 | 3.11 | 4.5 | 4.28 | 3.6 | 3.6 | 3.6 | 3.6 | 3.6 |
| PV UFCF | ||||||||||
| SUM PV UFCF | 14,781.3 | |||||||||
| Long Term Growth Rate, % | 2.00 | |||||||||
| Free cash flow (T + 1) | 2,057 | |||||||||
| Terminal Value | 128,923 | |||||||||
| Present Terminal Value | 108,051 | |||||||||
| Enterprise Value | 122,832 | |||||||||
| Net Debt | 20,787 | |||||||||
| Equity Value | 102,045 | |||||||||
| Diluted Shares Outstanding, MM | 10,604 | |||||||||
| Equity Value Per Share | 9.62 |
ماذا ستتلقى
- البيانات المالية 600022SS الأصلية: تم تحميلها مسبقًا مع بيانات Shandong Iron and Steel Company Ltd. التاريخية والمتوقعة للتحليل الدقيق.
- قالب قابل للتخصيص تمامًا: تعديل المدخلات الهامة بسهولة مثل نمو الإيرادات ، WACC ، و EBITDA ٪.
- الحسابات الفورية: شاهد القيمة الجوهرية لتحديث Shandong Iron and Steel Company Ltd. في الوقت الفعلي أثناء إجراء التعديلات.
- أداة تقييم الخبراء: مصمم للمستثمرين والمحللين والمستشارين الذين يهدفون إلى نتائج DCF دقيقة.
- تصميم يمكن الوصول إليه: التصميم البديهي والتعليمات المباشرة المناسبة لجميع مستويات المهارة.
الميزات الرئيسية
- البيانات التي تم تحميلها مسبقًا: البيانات التاريخية لشركة Shandong Iron and Steel Company والتوقعات المليئة مسبقًا.
- مدخلات قابلة للتعديل بالكامل: تعديل WACC ، ومعدلات الضرائب ، ونمو الإيرادات ، وهامش EBITDA حسب الحاجة.
- النتائج الفورية: عرض القيمة الجوهرية للحديد والفولاذ شاندونغ في الوقت الفعلي.
- واضحة المخرجات المرئية: تقدم مخططات لوحة القيادة نتائج التقييم ومقاييس الأداء الرئيسية.
- بنيت للدقة: أداة احترافية مصممة للمحللين والمستثمرين والمهنيين المالية.
كيف تعمل
- الخطوة 1: قم بتنزيل ملف Excel.
- الخطوة 2: راجع البيانات المالية المملوءة مسبقًا لشركة Shandong Iron and Steel.
- الخطوة 3: ضبط المدخلات الرئيسية مثل نمو الإيرادات ، WACC ، ومعدلات الضرائب (الخلايا المميزة).
- الخطوة 4: راقب تحديث نموذج DCF على الفور أثناء تعديل الافتراضات.
- الخطوة 5: تحليل المخرجات والاستفادة من النتائج لقرارات الاستثمار الخاصة بك.
لماذا تختار أداة التقييم هذه؟
- بيانات موثوقة: أرقام مالية أصيلة من شركة Shandong Iron and Steel Company Ltd. تضمن نتائج التقييم التي يمكن الاعتماد عليها.
- مصممة خصيصًا: قم بتعديل المعلمات الأساسية مثل معدلات النمو ، و WACC ، ومعدلات الضرائب لتتماشى مع توقعاتك.
- زيادة الكفاءة: توفر لك الحسابات الجاهزة للاستخدام متاعبًا من البدء من الصفر.
- مورد قياسي الصناعة: صُنعت للمستثمرين والمحللين والمستشارين في هذا المجال.
- سهل الاستخدام: تصميم سهل الاستخدام وتوجيهات خطوة بخطوة تجعله في متناول الجميع.
من الذي يمكن أن يستفيد من شركة Shandong Iron and Steel Company Ltd. (600022SS)؟
- المستثمرون: تمكين قراراتك الاستثمارية من خلال تحليل موثوق الخاص بأداء Shandong Iron and Steel.
- المحللون الماليون: قم بتبسيط سير العمل الخاص بك مع نموذج مالي مصمم مصمم للتقييم المتعمق لـ (600022SS).
- الاستشاريون: قم بتعديل القالب دون عناء للعروض التقديمية المؤثرة أو الرؤى التي تركز على الحديد والصلب Shandong.
- عشاق المالية: عزز معرفتك بصناعة الصلب من خلال استكشاف سيناريوهات التقييم في العالم الحقيقي المتعلقة بـ (600022SS).
- المعلمون والطلاب: استفد من هذا المورد كأداة تعليمية عملية في دورات التمويل والاستثمار التي تركز على سوق الصلب.
محتويات القالب
- البيانات المليئة مسبقا: يتميز بيانات وتوقعات Shandong Iron and Steel التاريخية.
- نموذج التدفق النقدي المخفض: نموذج تقييم DCF قابل للتحرير يقوم بحسابات تلقائية.
- متوسط تكلفة رأس المال المرجح (WACC): ورقة متخصصة لحساب WACC استنادًا إلى المدخلات المعرفة من قبل المستخدم.
- النسب المالية الرئيسية: فحص ربحية Shandong للحديد والصلب والكفاءة والرافعة المالية.
- مدخلات قابلة للتخصيص: بسهولة ضبط نمو الإيرادات ، هوامش الربح ، ومعدلات الضرائب.
- لوحة القيادة الصافية: الصور المرئية والجداول التي تلخص نتائج التقييم الأساسية.
Disclaimer
All information, articles, and product details provided on this website are for general informational and educational purposes only. We do not claim any ownership over, nor do we intend to infringe upon, any trademarks, copyrights, logos, brand names, or other intellectual property mentioned or depicted on this site. Such intellectual property remains the property of its respective owners, and any references here are made solely for identification or informational purposes, without implying any affiliation, endorsement, or partnership.
We make no representations or warranties, express or implied, regarding the accuracy, completeness, or suitability of any content or products presented. Nothing on this website should be construed as legal, tax, investment, financial, medical, or other professional advice. In addition, no part of this site—including articles or product references—constitutes a solicitation, recommendation, endorsement, advertisement, or offer to buy or sell any securities, franchises, or other financial instruments, particularly in jurisdictions where such activity would be unlawful.
All content is of a general nature and may not address the specific circumstances of any individual or entity. It is not a substitute for professional advice or services. Any actions you take based on the information provided here are strictly at your own risk. You accept full responsibility for any decisions or outcomes arising from your use of this website and agree to release us from any liability in connection with your use of, or reliance upon, the content or products found herein.