
|
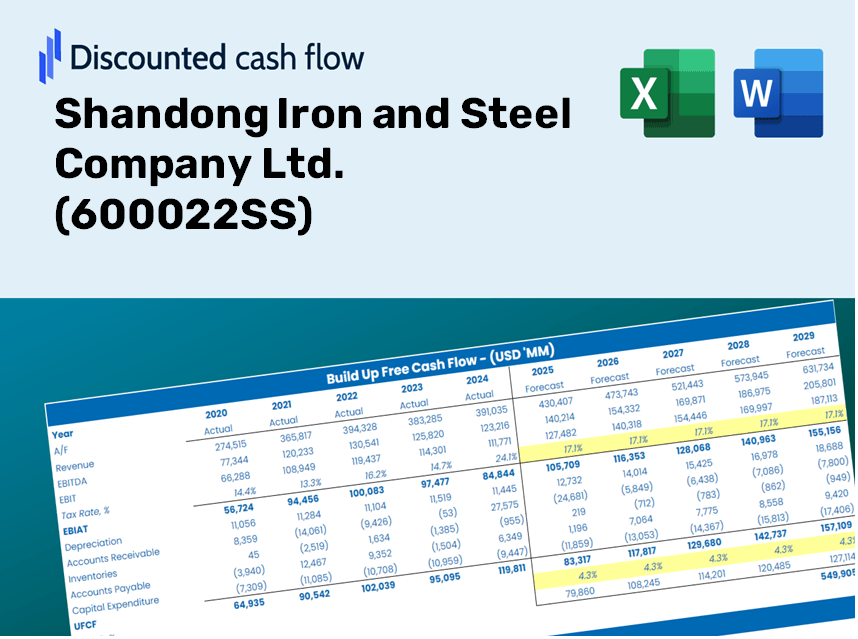
Shandong Iron and Steel Company Ltd. (600022.SS) DCF -Bewertung |
Fully Editable: Tailor To Your Needs In Excel Or Sheets
Professional Design: Trusted, Industry-Standard Templates
Investor-Approved Valuation Models
MAC/PC Compatible, Fully Unlocked
No Expertise Is Needed; Easy To Follow
Shandong Iron and Steel Company Ltd. (600022.SS) Bundle
Entdecken Sie die finanziellen Aussichten von Shandong Iron and Steel Company Ltd. (600022SS) mit unserem benutzerfreundlichen DCF-Taschenrechner! Geben Sie Ihre Prognosen für Wachstum, Margen und Kosten ein, um den inneren Wert von Shandong Iron and Steel Company Ltd. (600022S) zu bestimmen und Ihre Anlagestrategie zu verbessern.
Discounted Cash Flow (DCF) - (USD MM)
| Year | AY1 2020 |
AY2 2021 |
AY3 2022 |
AY4 2023 |
AY5 2024 |
FY1 2025 |
FY2 2026 |
FY3 2027 |
FY4 2028 |
FY5 2029 |
|---|---|---|---|---|---|---|---|---|---|---|
| Revenue | 87,316.7 | 110,850.9 | 102,289.4 | 90,475.1 | 82,094.1 | 85,580.9 | 89,215.8 | 93,005.0 | 96,955.2 | 101,073.2 |
| Revenue Growth, % | 0 | 26.95 | -7.72 | -11.55 | -9.26 | 4.25 | 4.25 | 4.25 | 4.25 | 4.25 |
| EBITDA | 5,181.0 | 6,672.1 | 3,809.8 | 2,263.3 | 53.7 | 3,122.7 | 3,255.3 | 3,393.6 | 3,537.7 | 3,688.0 |
| EBITDA, % | 5.93 | 6.02 | 3.72 | 2.5 | 0.06539941 | 3.65 | 3.65 | 3.65 | 3.65 | 3.65 |
| Depreciation | 2,643.3 | 2,565.1 | 2,357.1 | 2,342.3 | 2,326.2 | 2,236.7 | 2,331.7 | 2,430.8 | 2,534.0 | 2,641.7 |
| Depreciation, % | 3.03 | 2.31 | 2.3 | 2.59 | 2.83 | 2.61 | 2.61 | 2.61 | 2.61 | 2.61 |
| EBIT | 2,537.8 | 4,107.0 | 1,452.7 | -79.0 | -2,272.5 | 885.9 | 923.6 | 962.8 | 1,003.7 | 1,046.3 |
| EBIT, % | 2.91 | 3.7 | 1.42 | -0.08736562 | -2.77 | 1.04 | 1.04 | 1.04 | 1.04 | 1.04 |
| Total Cash | 6,832.1 | 9,833.8 | 7,891.8 | 6,141.5 | 4,864.8 | 6,354.3 | 6,624.2 | 6,905.6 | 7,198.9 | 7,504.6 |
| Total Cash, percent | .0 | .0 | .0 | .0 | .0 | .0 | .0 | .0 | .0 | .0 |
| Account Receivables | 3,940.9 | 2,502.7 | 2,057.6 | 2,717.4 | 1,758.5 | 2,383.9 | 2,485.2 | 2,590.7 | 2,700.8 | 2,815.5 |
| Account Receivables, % | 4.51 | 2.26 | 2.01 | 3 | 2.14 | 2.79 | 2.79 | 2.79 | 2.79 | 2.79 |
| Inventories | 5,082.9 | 6,110.8 | 4,983.2 | 4,814.1 | 5,264.0 | 4,782.0 | 4,985.1 | 5,196.9 | 5,417.6 | 5,647.7 |
| Inventories, % | 5.82 | 5.51 | 4.87 | 5.32 | 6.41 | 5.59 | 5.59 | 5.59 | 5.59 | 5.59 |
| Accounts Payable | 16,847.4 | 18,017.7 | 17,407.6 | 18,519.3 | 6,841.0 | 13,927.2 | 14,518.7 | 15,135.4 | 15,778.2 | 16,448.4 |
| Accounts Payable, % | 19.29 | 16.25 | 17.02 | 20.47 | 8.33 | 16.27 | 16.27 | 16.27 | 16.27 | 16.27 |
| Capital Expenditure | -2,155.0 | -2,433.4 | -1,938.7 | -697.4 | -340.6 | -1,325.5 | -1,381.8 | -1,440.5 | -1,501.7 | -1,565.5 |
| Capital Expenditure, % | -2.47 | -2.2 | -1.9 | -0.77079 | -0.41493 | -1.55 | -1.55 | -1.55 | -1.55 | -1.55 |
| Tax Rate, % | 9.95 | 9.95 | 9.95 | 9.95 | 9.95 | 9.95 | 9.95 | 9.95 | 9.95 | 9.95 |
| EBITAT | 930.5 | 1,250.5 | 534.0 | -321.6 | -2,046.3 | 520.8 | 542.9 | 566.0 | 590.0 | 615.1 |
| Depreciation | ||||||||||
| Changes in Account Receivables | ||||||||||
| Changes in Inventories | ||||||||||
| Changes in Accounts Payable | ||||||||||
| Capital Expenditure | ||||||||||
| UFCF | 9,242.4 | 2,962.9 | 1,914.9 | 1,944.4 | -11,230.1 | 8,374.7 | 1,780.0 | 1,855.6 | 1,934.4 | 2,016.6 |
| WACC, % | 3.11 | 2.97 | 3.11 | 4.5 | 4.28 | 3.6 | 3.6 | 3.6 | 3.6 | 3.6 |
| PV UFCF | ||||||||||
| SUM PV UFCF | 14,781.3 | |||||||||
| Long Term Growth Rate, % | 2.00 | |||||||||
| Free cash flow (T + 1) | 2,057 | |||||||||
| Terminal Value | 128,923 | |||||||||
| Present Terminal Value | 108,051 | |||||||||
| Enterprise Value | 122,832 | |||||||||
| Net Debt | 20,787 | |||||||||
| Equity Value | 102,045 | |||||||||
| Diluted Shares Outstanding, MM | 10,604 | |||||||||
| Equity Value Per Share | 9.62 |
What You Will Receive
- Genuine 600022SS Financial Data: Pre-loaded with Shandong Iron and Steel Company Ltd.'s historical and forecasted data for accurate analysis.
- Completely Customizable Template: Easily adjust critical inputs such as revenue growth, WACC, and EBITDA %.
- Instant Calculations: Watch the intrinsic value of Shandong Iron and Steel Company Ltd. update in real-time as you make adjustments.
- Expert Valuation Tool: Tailored for investors, analysts, and consultants aiming for precise DCF outcomes.
- Accessible Design: Intuitive layout and straightforward instructions suitable for all skill levels.
Key Features
- Pre-Loaded Data: Shandong Iron and Steel Company's historical financial statements and pre-filled forecasts.
- Fully Adjustable Inputs: Modify WACC, tax rates, revenue growth, and EBITDA margins as needed.
- Instant Results: View Shandong Iron and Steel's intrinsic value recalculated in real time.
- Clear Visual Outputs: Dashboard charts present valuation results and key performance metrics.
- Built for Accuracy: A professional tool designed for analysts, investors, and finance professionals.
How It Works
- Step 1: Download the Excel file.
- Step 2: Review Shandong Iron and Steel Company's pre-filled financial data and forecasts.
- Step 3: Adjust key inputs such as revenue growth, WACC, and tax rates (highlighted cells).
- Step 4: Observe the DCF model update instantly as you modify the assumptions.
- Step 5: Analyze the outputs and leverage the results for your investment decisions.
Why Opt for This Valuation Tool?
- Reliable Data: Authentic financial figures from Shandong Iron and Steel Company Ltd. ensure dependable valuation outcomes.
- Tailor-Made: Modify essential parameters such as growth rates, WACC, and tax rates to align with your forecasts.
- Efficiency Boost: Ready-to-use calculations save you the hassle of starting from zero.
- Industry-Standard Resource: Crafted for investors, analysts, and consultants in the field.
- Easy to Use: User-friendly design and clear step-by-step guidance make it accessible for everyone.
Who Can Benefit from Shandong Iron and Steel Company Ltd. (600022SS)?
- Investors: Empower your investment decisions with a reliable analysis specific to Shandong Iron and Steel's performance.
- Financial Analysts: Streamline your workflow with a tailored financial model designed for in-depth evaluation of (600022SS).
- Consultants: Effortlessly modify the template for impactful client presentations or insights focused on Shandong Iron and Steel.
- Finance Enthusiasts: Enhance your knowledge of the steel industry by exploring real-world valuation scenarios related to (600022SS).
- Educators and Students: Utilize this resource as a hands-on learning tool in finance and investment courses centered on the steel market.
Contents of the Template
- Pre-Filled Data: Features Shandong Iron and Steel's historical financial data and projections.
- Discounted Cash Flow Model: An editable DCF valuation model that performs automatic calculations.
- Weighted Average Cost of Capital (WACC): A specialized sheet for computing WACC based on user-defined inputs.
- Key Financial Ratios: Examine Shandong Iron and Steel's profitability, efficiency, and financial leverage.
- Customizable Inputs: Easily adjust revenue growth, profit margins, and tax rates.
- Clear Dashboard: Visuals and tables that summarize essential valuation results.
Disclaimer
All information, articles, and product details provided on this website are for general informational and educational purposes only. We do not claim any ownership over, nor do we intend to infringe upon, any trademarks, copyrights, logos, brand names, or other intellectual property mentioned or depicted on this site. Such intellectual property remains the property of its respective owners, and any references here are made solely for identification or informational purposes, without implying any affiliation, endorsement, or partnership.
We make no representations or warranties, express or implied, regarding the accuracy, completeness, or suitability of any content or products presented. Nothing on this website should be construed as legal, tax, investment, financial, medical, or other professional advice. In addition, no part of this site—including articles or product references—constitutes a solicitation, recommendation, endorsement, advertisement, or offer to buy or sell any securities, franchises, or other financial instruments, particularly in jurisdictions where such activity would be unlawful.
All content is of a general nature and may not address the specific circumstances of any individual or entity. It is not a substitute for professional advice or services. Any actions you take based on the information provided here are strictly at your own risk. You accept full responsibility for any decisions or outcomes arising from your use of this website and agree to release us from any liability in connection with your use of, or reliance upon, the content or products found herein.