
|
Xining Special Steel Co. ، Ltd. (600117.SS) تقييم DCF |
Fully Editable: Tailor To Your Needs In Excel Or Sheets
Professional Design: Trusted, Industry-Standard Templates
Investor-Approved Valuation Models
MAC/PC Compatible, Fully Unlocked
No Expertise Is Needed; Easy To Follow
XiNing Special Steel Co., Ltd. (600117.SS) Bundle
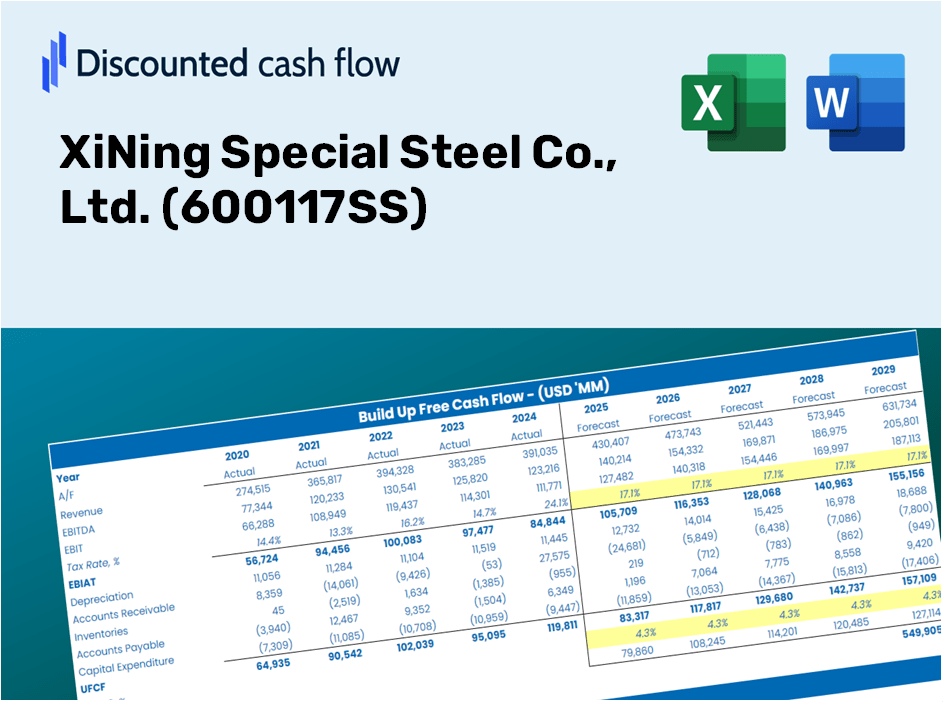
سواء كنت مستثمرًا أو محللًا ، فإن حاسبة DCF (600117SS) هذه هي مورد الخاص بك للتقييم الدقيق. مزودة ببيانات حقيقية من شركة Xining Special Steel Co. ، Ltd. ، يمكنك ضبط التوقعات ومراقبة التأثيرات في الوقت الفعلي.
Discounted Cash Flow (DCF) - (USD MM)
| Year | AY1 2020 |
AY2 2021 |
AY3 2022 |
AY4 2023 |
AY5 2024 |
FY1 2025 |
FY2 2026 |
FY3 2027 |
FY4 2028 |
FY5 2029 |
|---|---|---|---|---|---|---|---|---|---|---|
| Revenue | 10,075.5 | 12,234.3 | 7,757.2 | 4,939.1 | 5,717.2 | 5,206.3 | 4,741.1 | 4,317.4 | 3,931.6 | 3,580.3 |
| Revenue Growth, % | 0 | 21.43 | -36.59 | -36.33 | 15.75 | -8.94 | -8.94 | -8.94 | -8.94 | -8.94 |
| EBITDA | 1,079.2 | 729.4 | -369.9 | -674.0 | -228.3 | -59.7 | -54.4 | -49.5 | -45.1 | -41.1 |
| EBITDA, % | 10.71 | 5.96 | -4.77 | -13.65 | -3.99 | -1.15 | -1.15 | -1.15 | -1.15 | -1.15 |
| Depreciation | 483.7 | 517.0 | 516.4 | 487.4 | 564.4 | 368.8 | 335.9 | 305.9 | 278.5 | 253.6 |
| Depreciation, % | 4.8 | 4.23 | 6.66 | 9.87 | 9.87 | 7.08 | 7.08 | 7.08 | 7.08 | 7.08 |
| EBIT | 595.5 | 212.5 | -886.2 | -1,161.4 | -792.6 | -428.5 | -390.2 | -355.4 | -323.6 | -294.7 |
| EBIT, % | 5.91 | 1.74 | -11.42 | -23.51 | -13.86 | -8.23 | -8.23 | -8.23 | -8.23 | -8.23 |
| Total Cash | 1,685.8 | 1,110.8 | 1,229.8 | 710.0 | 103.5 | 602.4 | 548.5 | 499.5 | 454.9 | 414.2 |
| Total Cash, percent | .0 | .0 | .0 | .0 | .0 | .0 | .0 | .0 | .0 | .0 |
| Account Receivables | 905.5 | 2,666.4 | 1,205.1 | 957.6 | 862.5 | 841.3 | 766.1 | 697.6 | 635.3 | 578.5 |
| Account Receivables, % | 8.99 | 21.79 | 15.53 | 19.39 | 15.09 | 16.16 | 16.16 | 16.16 | 16.16 | 16.16 |
| Inventories | 2,437.7 | 2,271.8 | 2,040.8 | 1,379.2 | 1,308.9 | 1,248.4 | 1,136.8 | 1,035.2 | 942.7 | 858.5 |
| Inventories, % | 24.19 | 18.57 | 26.31 | 27.92 | 22.89 | 23.98 | 23.98 | 23.98 | 23.98 | 23.98 |
| Accounts Payable | 2,478.7 | 872.7 | 196.9 | 1,123.0 | 970.4 | 770.4 | 701.5 | 638.8 | 581.7 | 529.8 |
| Accounts Payable, % | 24.6 | 7.13 | 2.54 | 22.74 | 16.97 | 14.8 | 14.8 | 14.8 | 14.8 | 14.8 |
| Capital Expenditure | -92.5 | -86.6 | -81.6 | -30.7 | -31.5 | -40.1 | -36.5 | -33.2 | -30.3 | -27.6 |
| Capital Expenditure, % | -0.91822 | -0.70809 | -1.05 | -0.62169 | -0.55038 | -0.7701 | -0.7701 | -0.7701 | -0.7701 | -0.7701 |
| Tax Rate, % | 27.66 | 27.66 | 27.66 | 27.66 | 27.66 | 27.66 | 27.66 | 27.66 | 27.66 | 27.66 |
| EBITAT | 157.8 | 93.0 | -637.5 | -1,562.1 | -573.3 | -269.6 | -245.5 | -223.6 | -203.6 | -185.4 |
| Depreciation | ||||||||||
| Changes in Account Receivables | ||||||||||
| Changes in Inventories | ||||||||||
| Changes in Accounts Payable | ||||||||||
| Capital Expenditure | ||||||||||
| UFCF | -315.6 | -2,677.6 | 813.8 | 729.8 | -27.7 | -59.0 | 171.8 | 156.4 | 142.4 | 129.7 |
| WACC, % | 9.75 | 10.01 | 10.43 | 10.84 | 10.43 | 10.29 | 10.29 | 10.29 | 10.29 | 10.29 |
| PV UFCF | ||||||||||
| SUM PV UFCF | 380.0 | |||||||||
| Long Term Growth Rate, % | 2.00 | |||||||||
| Free cash flow (T + 1) | 132 | |||||||||
| Terminal Value | 1,596 | |||||||||
| Present Terminal Value | 978 | |||||||||
| Enterprise Value | 1,358 | |||||||||
| Net Debt | 320 | |||||||||
| Equity Value | 1,038 | |||||||||
| Diluted Shares Outstanding, MM | 3,255 | |||||||||
| Equity Value Per Share | 0.32 |
الفوائد التي يمكنك توقعها
- البيانات المالية 600117SS الأصلية: تم تحميله مسبقًا بأرقام مالية تاريخية ومتوقعة من Xining Steel للتقييمات الدقيقة.
- قالب قابل للتخصيص تمامًا: بسهولة ضبط المتغيرات الرئيسية مثل نمو الإيرادات ، WACC ، وهامش EBITDA.
- الحسابات الفورية: شاهد القيمة الجوهرية لتحديث Xining Special Steel بناءً على تعديلات الإدخال الخاصة بك.
- أداة تقييم الخبراء: مصمم للمستثمرين والمحللين والمستشارين الذين يحتاجون إلى تحليل موثوق DCF.
- واجهة بديهية: تم تصميمه بتخطيط مباشر وإرشادات واضحة مناسبة لجميع مستويات المهارة.
الميزات الرئيسية
- 🔍 واقعية XININ البيانات التاريخية والمتوقعة المليئة مسبقًا لشركة Xining Special Steel Co. ، Ltd. (600117SS).
- ✏️ مدخلات قابلة للتخصيص بالكامل: اضبط جميع المعلمات الهامة (الخلايا الصفراء) مثل WACC و Growth ٪ ومعدلات الضرائب.
- 📊 تقييم DCF المهني: الصيغ المدمجة حساب القيمة الجوهرية لـ Xining باستخدام طريقة التدفق النقدي المخفض.
- ⚡ النتائج الفورية: تصور تقييم Xining على الفور بعد إجراء تغييرات.
- تحليل السيناريو: اختبار ومقارنة النتائج لمختلف الافتراضات المالية جنبًا إلى جنب.
كيف تعمل
- الخطوة 1: قم بتنزيل قالب Excel Prebuilt الذي يضم بيانات Xining Special Steel Co. ، Ltd. (600117ss).
- الخطوة 2: راجع الأوراق المملوءة مسبقًا للتعرف على المقاييس المالية الرئيسية.
- الخطوة 3: تعديل التنبؤات والافتراضات في الخلايا الصفراء القابلة للتحرير (WACC ، النمو ، الهوامش).
- الخطوة 4: الوصول على الفور النتائج المعاد حسابها ، بما في ذلك القيمة الجوهرية لشركة Xining Special Steel Co. ، Ltd. (600117SS).
- الخطوة 5: اتخاذ قرارات استثمارية مستنيرة أو إنشاء تقارير بناءً على المخرجات التي تم إنشاؤها.
لماذا تختار حاسبة Xining Special Steel Co. ، Ltd. (600117SS)؟
- كفاءة الوقت: تخطي متاعب بناء نموذج DCF من نقطة الصفر - أداةنا جاهزة للاستخدام الفوري.
- الدقة المعززة: البيانات المالية التي يمكن الاعتماد عليها تقلل من أخطاء التقييم.
- قابلة للتخصيص تماما: تكييف النموذج لتناسب افتراضاتك وتوقعاتك المحددة.
- سهل الاستخدام: المخططات والمخرجات البديهية تبسيط تحليل النتائج.
- معتمدة بخبرة: تم تصميمه للمهنيين الذين يعطون الأولوية للدقة والوظائف.
من الذي يمكن أن يستفيد من Xining Special Steel Co. ، Ltd. (600117SS)؟
- المستثمرون: تمكين اختياراتك الاستثمارية مع أداة تقييم عالية الجودة.
- المحللون الماليون: عزز كفاءتك من خلال نموذج DCF مصمم مسبقًا يسمح بتخصيص سهل.
- الاستشاريون: تخصيص القالب بسلاسة لعروض العميل والتقارير في أي وقت من الأوقات.
- عشاق صناعة الصلب: عزز معرفتك بطرق التقييم من خلال التطبيقات العملية الواقعية.
- المعلمون والطلاب: الاستفادة منها كمورد تعليمي قيّم في الدورات المالية والمرتبطة بالصناعة.
محتويات القالب
- البيانات التاريخية: يحتوي على Xining Special Steel Co. ، Ltd. الأداء المالي السابق والتنبؤات التأسيسية.
- نماذج DCF و Ruvered DCF: قوالب شاملة مصممة لتقييم القيمة الجوهرية لشركة Xining Special Steel Co. ، Ltd. (600117SS).
- ورقة WACC: مقاييس محسوبة مسبقًا لمتوسط تكلفة رأس المال المرجح.
- مدخلات قابلة للتحرير: اضبط المتغيرات الأساسية مثل معدلات النمو ، EBITDA ٪ ، وتقديرات CAPEX.
- البيانات الفصلية والسنوية: شاملة overview من Xining Special Steel Co. ، Ltd. البيانات المالية.
- لوحة القيادة التفاعلية: تصور بشكل ديناميكي نتائج التقييم والتوقعات المستقبلية.
Disclaimer
All information, articles, and product details provided on this website are for general informational and educational purposes only. We do not claim any ownership over, nor do we intend to infringe upon, any trademarks, copyrights, logos, brand names, or other intellectual property mentioned or depicted on this site. Such intellectual property remains the property of its respective owners, and any references here are made solely for identification or informational purposes, without implying any affiliation, endorsement, or partnership.
We make no representations or warranties, express or implied, regarding the accuracy, completeness, or suitability of any content or products presented. Nothing on this website should be construed as legal, tax, investment, financial, medical, or other professional advice. In addition, no part of this site—including articles or product references—constitutes a solicitation, recommendation, endorsement, advertisement, or offer to buy or sell any securities, franchises, or other financial instruments, particularly in jurisdictions where such activity would be unlawful.
All content is of a general nature and may not address the specific circumstances of any individual or entity. It is not a substitute for professional advice or services. Any actions you take based on the information provided here are strictly at your own risk. You accept full responsibility for any decisions or outcomes arising from your use of this website and agree to release us from any liability in connection with your use of, or reliance upon, the content or products found herein.