
|
Xining Special Steel Co., Ltd. (600117.SS) Avaliação DCF |
Totalmente Editável: Adapte-Se Às Suas Necessidades No Excel Ou Planilhas
Design Profissional: Modelos Confiáveis E Padrão Da Indústria
Pré-Construídos Para Uso Rápido E Eficiente
Compatível com MAC/PC, totalmente desbloqueado
Não É Necessária Experiência; Fácil De Seguir
XiNing Special Steel Co., Ltd. (600117.SS) Bundle
Seja você um investidor ou analista, esta calculadora (600117SS) DCF é o seu recurso preferido para uma avaliação precisa. Equipado com dados reais da Xining Special Steel Co., Ltd., você pode ajustar as previsões e observar os efeitos em tempo real.
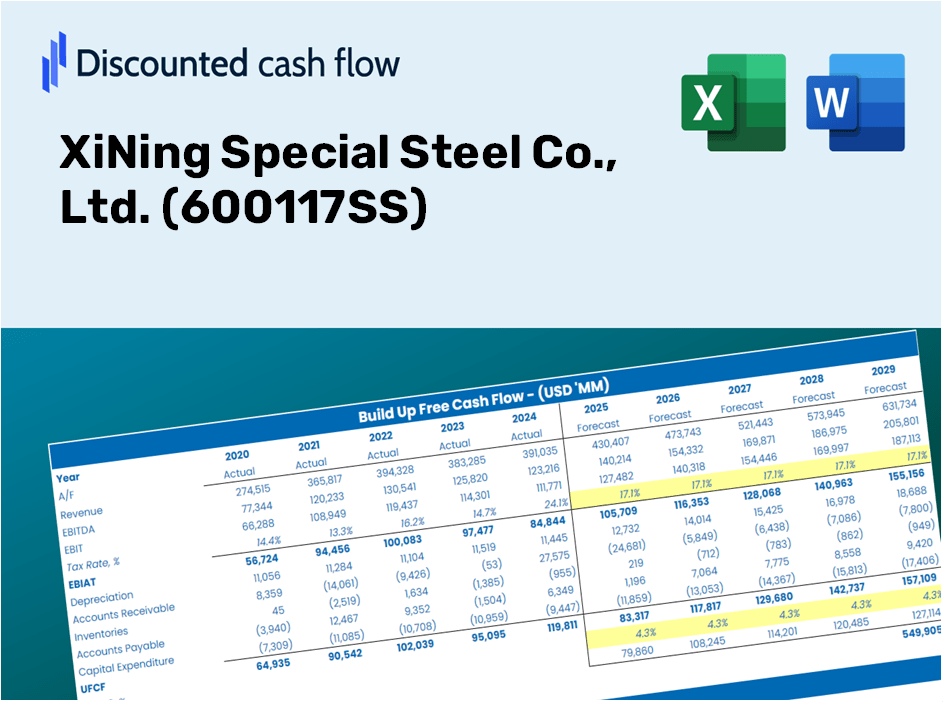
Discounted Cash Flow (DCF) - (USD MM)
| Year | AY1 2020 |
AY2 2021 |
AY3 2022 |
AY4 2023 |
AY5 2024 |
FY1 2025 |
FY2 2026 |
FY3 2027 |
FY4 2028 |
FY5 2029 |
|---|---|---|---|---|---|---|---|---|---|---|
| Revenue | 10,075.5 | 12,229.1 | 7,757.2 | 4,939.1 | 5,717.2 | 5,206.0 | 4,740.4 | 4,316.5 | 3,930.6 | 3,579.1 |
| Revenue Growth, % | 0 | 21.37 | -36.57 | -36.33 | 15.75 | -8.94 | -8.94 | -8.94 | -8.94 | -8.94 |
| EBITDA | 1,094.0 | -1,561.1 | -564.9 | 1,752.9 | -531.0 | 177.1 | 161.3 | 146.9 | 133.7 | 121.8 |
| EBITDA, % | 10.86 | -12.77 | -7.28 | 35.49 | -9.29 | 3.4 | 3.4 | 3.4 | 3.4 | 3.4 |
| Depreciation | 483.7 | 517.0 | 516.9 | 499.7 | 569.1 | 372.3 | 339.1 | 308.7 | 281.1 | 256.0 |
| Depreciation, % | 4.8 | 4.23 | 6.66 | 10.12 | 9.95 | 7.15 | 7.15 | 7.15 | 7.15 | 7.15 |
| EBIT | 610.3 | -2,078.1 | -1,081.8 | 1,253.2 | -1,100.1 | -195.2 | -177.8 | -161.9 | -147.4 | -134.2 |
| EBIT, % | 6.06 | -16.99 | -13.95 | 25.37 | -19.24 | -3.75 | -3.75 | -3.75 | -3.75 | -3.75 |
| Total Cash | 1,685.8 | 1,110.8 | 1,229.8 | 710.0 | 103.5 | 602.4 | 548.5 | 499.4 | 454.8 | 414.1 |
| Total Cash, percent | .0 | .0 | .0 | .0 | .0 | .0 | .0 | .0 | .0 | .0 |
| Account Receivables | 905.5 | 2,666.4 | 1,205.1 | 957.6 | 862.5 | 841.3 | 766.1 | 697.6 | 635.2 | 578.4 |
| Account Receivables, % | 8.99 | 21.8 | 15.53 | 19.39 | 15.09 | 16.16 | 16.16 | 16.16 | 16.16 | 16.16 |
| Inventories | 2,437.7 | 2,271.8 | 2,040.8 | 1,379.2 | 1,308.9 | 1,248.4 | 1,136.7 | 1,035.1 | 942.5 | 858.2 |
| Inventories, % | 24.19 | 18.58 | 26.31 | 27.92 | 22.89 | 23.98 | 23.98 | 23.98 | 23.98 | 23.98 |
| Accounts Payable | 2,478.7 | 872.7 | 196.9 | 1,123.0 | 970.4 | 770.3 | 701.4 | 638.7 | 581.6 | 529.6 |
| Accounts Payable, % | 24.6 | 7.14 | 2.54 | 22.74 | 16.97 | 14.8 | 14.8 | 14.8 | 14.8 | 14.8 |
| Capital Expenditure | -92.5 | -86.6 | -81.6 | -30.7 | -31.5 | -40.1 | -36.5 | -33.2 | -30.3 | -27.6 |
| Capital Expenditure, % | -0.91822 | -0.70839 | -1.05 | -0.62169 | -0.55038 | -0.77016 | -0.77016 | -0.77016 | -0.77016 | -0.77016 |
| Tax Rate, % | 27.66 | 27.66 | 27.66 | 27.66 | 27.66 | 27.66 | 27.66 | 27.66 | 27.66 | 27.66 |
| EBITAT | 161.7 | -909.1 | -778.1 | 1,685.6 | -795.7 | -122.8 | -111.8 | -101.8 | -92.7 | -84.4 |
| Depreciation | ||||||||||
| Changes in Account Receivables | ||||||||||
| Changes in Inventories | ||||||||||
| Changes in Accounts Payable | ||||||||||
| Capital Expenditure | ||||||||||
| UFCF | -311.6 | -3,679.7 | 673.7 | 3,989.7 | -245.4 | 91.2 | 308.7 | 281.1 | 256.0 | 233.1 |
| WACC, % | 7.04 | 7.27 | 7.64 | 8 | 7.64 | 7.52 | 7.52 | 7.52 | 7.52 | 7.52 |
| PV UFCF | ||||||||||
| SUM PV UFCF | 931.8 | |||||||||
| Long Term Growth Rate, % | 2.00 | |||||||||
| Free cash flow (T + 1) | 238 | |||||||||
| Terminal Value | 4,309 | |||||||||
| Present Terminal Value | 2,999 | |||||||||
| Enterprise Value | 3,930 | |||||||||
| Net Debt | 320 | |||||||||
| Equity Value | 3,610 | |||||||||
| Diluted Shares Outstanding, MM | 3,255 | |||||||||
| Equity Value Per Share | 1.11 |
Benefits You Can Expect
- Authentic 600117SS Financial Data: Pre-loaded with XiNing Special Steel’s historical and forecasted financial figures for accurate assessments.
- Completely Customizable Template: Easily adjust key variables like revenue growth, WACC, and EBITDA margin.
- Instantaneous Calculations: Watch the intrinsic value of XiNing Special Steel update immediately based on your input modifications.
- Expert Valuation Tool: Tailored for investors, analysts, and consultants who require reliable DCF analysis.
- Intuitive Interface: Designed with a straightforward layout and clear guidance suitable for all skill levels.
Key Features
- 🔍 Real-Life XiNing Special Steel Financials: Pre-filled historical and projected data for XiNing Special Steel Co., Ltd. (600117SS).
- ✏️ Fully Customizable Inputs: Adjust all critical parameters (yellow cells) such as WACC, growth %, and tax rates.
- 📊 Professional DCF Valuation: Built-in formulas calculate XiNing's intrinsic value using the Discounted Cash Flow method.
- ⚡ Instant Results: Visualize XiNing's valuation instantly after making changes.
- Scenario Analysis: Test and compare outcomes for various financial assumptions side-by-side.
How It Works
- Step 1: Download the prebuilt Excel template featuring XiNing Special Steel Co., Ltd. (600117SS) data.
- Step 2: Review the pre-filled sheets to familiarize yourself with the key financial metrics.
- Step 3: Modify forecasts and assumptions in the editable yellow cells (WACC, growth, margins).
- Step 4: Instantly access recalculated results, including the intrinsic value of XiNing Special Steel Co., Ltd. (600117SS).
- Step 5: Make well-informed investment decisions or create reports based on the generated outputs.
Why Choose XiNing Special Steel Co., Ltd. (600117SS) Calculator?
- Time Efficiency: Skip the hassle of building a DCF model from scratch – our tool is ready for immediate use.
- Enhanced Precision: Dependable financial data and formulas minimize valuation errors.
- Completely Customizable: Adapt the model to suit your specific assumptions and forecasts.
- User-Friendly: Intuitive charts and outputs simplify the analysis of results.
- Expertly Endorsed: Crafted for professionals who prioritize accuracy and functionality.
Who Can Benefit from XiNing Special Steel Co., Ltd. (600117SS)?
- Investors: Empower your investment choices with a high-quality valuation instrument.
- Financial Analysts: Boost your efficiency with a pre-designed DCF model that allows for easy customization.
- Consultants: Seamlessly tailor the template for client presentations and reports in no time.
- Steel Industry Enthusiasts: Enhance your knowledge of valuation methods through practical, real-world applications.
- Educators and Students: Utilize it as a valuable educational resource in finance and industry-related courses.
Contents of the Template
- Historical Data: Contains XiNing Special Steel Co., Ltd.'s past financial performance and foundational forecasts.
- DCF and Levered DCF Models: Comprehensive templates designed to assess the intrinsic value of XiNing Special Steel Co., Ltd. (600117SS).
- WACC Sheet: Pre-calculated metrics for the Weighted Average Cost of Capital.
- Editable Inputs: Adjust essential variables such as growth rates, EBITDA %, and CAPEX estimates.
- Quarterly and Annual Statements: An exhaustive overview of XiNing Special Steel Co., Ltd.'s financial data.
- Interactive Dashboard: Dynamically visualize valuation outcomes and future projections.
Disclaimer
All information, articles, and product details provided on this website are for general informational and educational purposes only. We do not claim any ownership over, nor do we intend to infringe upon, any trademarks, copyrights, logos, brand names, or other intellectual property mentioned or depicted on this site. Such intellectual property remains the property of its respective owners, and any references here are made solely for identification or informational purposes, without implying any affiliation, endorsement, or partnership.
We make no representations or warranties, express or implied, regarding the accuracy, completeness, or suitability of any content or products presented. Nothing on this website should be construed as legal, tax, investment, financial, medical, or other professional advice. In addition, no part of this site—including articles or product references—constitutes a solicitation, recommendation, endorsement, advertisement, or offer to buy or sell any securities, franchises, or other financial instruments, particularly in jurisdictions where such activity would be unlawful.
All content is of a general nature and may not address the specific circumstances of any individual or entity. It is not a substitute for professional advice or services. Any actions you take based on the information provided here are strictly at your own risk. You accept full responsibility for any decisions or outcomes arising from your use of this website and agree to release us from any liability in connection with your use of, or reliance upon, the content or products found herein.