
|
شركة Baoji Titanium Industry Co. ، Ltd. (600456.SS) تقييم DCF |
Fully Editable: Tailor To Your Needs In Excel Or Sheets
Professional Design: Trusted, Industry-Standard Templates
Investor-Approved Valuation Models
MAC/PC Compatible, Fully Unlocked
No Expertise Is Needed; Easy To Follow
Baoji Titanium Industry Co., Ltd. (600456.SS) Bundle
تبحث لتقييم القيمة الجوهرية لشركة Baoji Titanium Industry Co. ، Ltd.؟ يدمج حاسبة DCF (600456SS) بيانات العالم الحقيقي مع ميزات تخصيص واسعة ، مما يتيح لك تحسين توقعاتك وتعزيز اختيارات الاستثمار الخاصة بك.
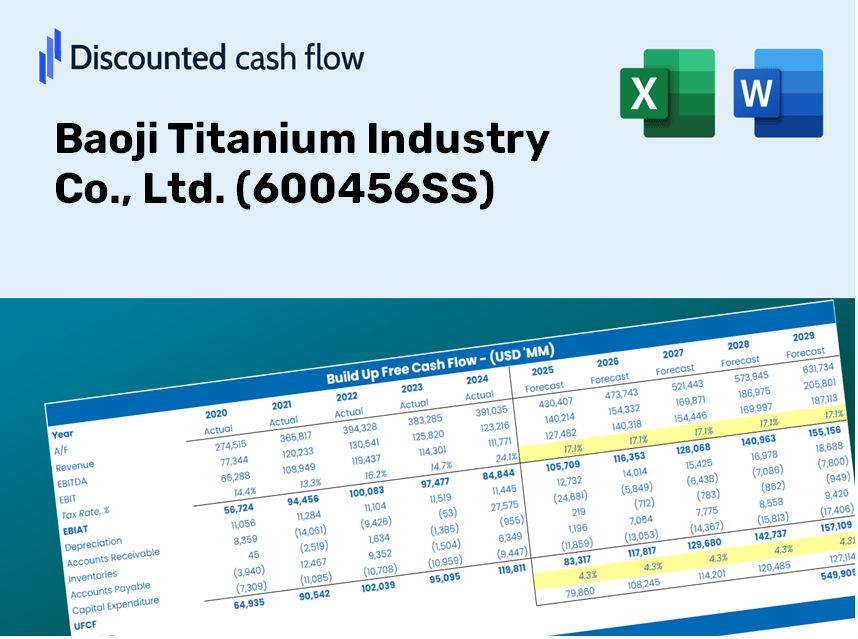
Discounted Cash Flow (DCF) - (USD MM)
| Year | AY1 2020 |
AY2 2021 |
AY3 2022 |
AY4 2023 |
AY5 2024 |
FY1 2025 |
FY2 2026 |
FY3 2027 |
FY4 2028 |
FY5 2029 |
|---|---|---|---|---|---|---|---|---|---|---|
| Revenue | 4,337.7 | 5,246.0 | 6,634.6 | 6,927.2 | 6,656.8 | 7,454.2 | 8,347.2 | 9,347.1 | 10,466.7 | 11,720.6 |
| Revenue Growth, % | 0 | 20.94 | 26.47 | 4.41 | -3.9 | 11.98 | 11.98 | 11.98 | 11.98 | 11.98 |
| EBITDA | 692.5 | 917.3 | 1,185.4 | 1,153.0 | 1,215.9 | 1,285.5 | 1,439.5 | 1,611.9 | 1,805.0 | 2,021.3 |
| EBITDA, % | 15.96 | 17.49 | 17.87 | 16.64 | 18.27 | 17.25 | 17.25 | 17.25 | 17.25 | 17.25 |
| Depreciation | 212.7 | 113.7 | 304.8 | 330.0 | 375.9 | 329.1 | 368.5 | 412.7 | 462.1 | 517.5 |
| Depreciation, % | 4.9 | 2.17 | 4.59 | 4.76 | 5.65 | 4.42 | 4.42 | 4.42 | 4.42 | 4.42 |
| EBIT | 479.8 | 803.6 | 880.7 | 823.0 | 840.0 | 956.4 | 1,071.0 | 1,199.3 | 1,342.9 | 1,503.8 |
| EBIT, % | 11.06 | 15.32 | 13.27 | 11.88 | 12.62 | 12.83 | 12.83 | 12.83 | 12.83 | 12.83 |
| Total Cash | 929.1 | 1,635.0 | 905.4 | 921.1 | 941.4 | 1,396.5 | 1,563.8 | 1,751.1 | 1,960.9 | 2,195.8 |
| Total Cash, percent | .0 | .0 | .0 | .0 | .0 | .0 | .0 | .0 | .0 | .0 |
| Account Receivables | 2,830.5 | 3,391.5 | 4,079.6 | 3,834.4 | 4,187.7 | 4,616.4 | 5,169.4 | 5,788.7 | 6,482.1 | 7,258.6 |
| Account Receivables, % | 65.25 | 64.65 | 61.49 | 55.35 | 62.91 | 61.93 | 61.93 | 61.93 | 61.93 | 61.93 |
| Inventories | 2,223.9 | 2,995.9 | 3,564.8 | 3,702.0 | 3,918.9 | 4,091.2 | 4,581.2 | 5,130.0 | 5,744.6 | 6,432.7 |
| Inventories, % | 51.27 | 57.11 | 53.73 | 53.44 | 58.87 | 54.88 | 54.88 | 54.88 | 54.88 | 54.88 |
| Accounts Payable | 900.0 | 1,452.3 | 1,576.8 | 1,619.8 | 1,842.3 | 1,837.6 | 2,057.7 | 2,304.2 | 2,580.2 | 2,889.3 |
| Accounts Payable, % | 20.75 | 27.68 | 23.77 | 23.38 | 27.67 | 24.65 | 24.65 | 24.65 | 24.65 | 24.65 |
| Capital Expenditure | -135.6 | -383.1 | -354.0 | -162.9 | -245.1 | -325.0 | -363.9 | -407.5 | -456.3 | -511.0 |
| Capital Expenditure, % | -3.13 | -7.3 | -5.34 | -2.35 | -3.68 | -4.36 | -4.36 | -4.36 | -4.36 | -4.36 |
| Tax Rate, % | 25.62 | 25.62 | 25.62 | 25.62 | 25.62 | 25.62 | 25.62 | 25.62 | 25.62 | 25.62 |
| EBITAT | 368.5 | 654.0 | 656.9 | 596.9 | 624.8 | 726.3 | 813.3 | 910.7 | 1,019.8 | 1,142.0 |
| Depreciation | ||||||||||
| Changes in Account Receivables | ||||||||||
| Changes in Inventories | ||||||||||
| Changes in Accounts Payable | ||||||||||
| Capital Expenditure | ||||||||||
| UFCF | -3,708.7 | -396.1 | -524.9 | 915.0 | 407.7 | 124.8 | -5.0 | -5.7 | -6.3 | -7.1 |
| WACC, % | 6.43 | 6.45 | 6.43 | 6.42 | 6.42 | 6.43 | 6.43 | 6.43 | 6.43 | 6.43 |
| PV UFCF | ||||||||||
| SUM PV UFCF | 98.0 | |||||||||
| Long Term Growth Rate, % | 3.00 | |||||||||
| Free cash flow (T + 1) | -7 | |||||||||
| Terminal Value | -213 | |||||||||
| Present Terminal Value | -156 | |||||||||
| Enterprise Value | -58 | |||||||||
| Net Debt | 442 | |||||||||
| Equity Value | -500 | |||||||||
| Diluted Shares Outstanding, MM | 478 | |||||||||
| Equity Value Per Share | -1.05 |
ما ستناله
- البيانات المالية الأصلية لـ BAO Titanium: مليئة مسبقًا بأرقام باوجي تيتانيوم التاريخية والمتوقعة للتحليل الدقيق.
- قالب قابل للتخصيص بالكامل: قم بتعديل المدخلات الرئيسية دون عناء مثل نمو الإيرادات و WACC ونسبة الأرباح قبل الفوائد والضرائب والاستهلاك وإطفاء الدين.
- الحسابات الفورية: شاهد القيمة الجوهرية لتحديث Baoji Titanium في الوقت الفعلي أثناء إجراء التغييرات.
- أداة تقييم الخبراء: مصممة للمستثمرين والمحللين والاستشاريين بحثًا عن نتائج DCF دقيقة.
- التصميم البديهي: تخطيط مبسط وتعليمات مباشرة مناسبة لجميع مستويات المهارة.
الميزات الرئيسية
- 🔍 الحياة الحقيقية [600456SS] البيانات المالية: البيانات التاريخية والمتوقعة المليئة مسبقًا لشركة Baoji Titanium Industry Co. ، Ltd.
- ✏️ مدخلات قابلة للتخصيص بالكامل: تعديل جميع المعلمات الأساسية (الخلايا الصفراء) مثل WACC و Growth ٪ ومعدلات الضرائب.
- 📊 تقييم DCF المهني: الصيغ المتكاملة تحسب القيمة الجوهرية لتيتانيوم Baoji باستخدام طريقة التدفق النقدي المخفض.
- ⚡ النتائج الفورية: عرض تقييم Baoji Titanium مباشرة بعد التعديلات.
- تحليل السيناريو: تقييم ومقارنة النتائج لمختلف الافتراضات المالية جنبا إلى جنب.
كيف تعمل
- الخطوة 1: قم بتنزيل ملف Excel لـ Baoji Titanium Industry Co. ، Ltd. (600456ss).
- الخطوة 2: فحص بيانات التيتانيوم المليئة مسبقًا (التاريخية والمتوقعة).
- الخطوة 3: تعديل الافتراضات الرئيسية (المبرمة باللون الأصفر) وفقا لتحليلك.
- الخطوة 4: راقب عمليات إعادة حساب الأوتوماتيكية للقيمة الجوهرية لشركة Baoji Titanium Industry Co. ، Ltd. (600456SS).
- الخطوة 5: الاستفادة من نتائج قرارات الاستثمار أو التقارير المالية.
لماذا اختر هذه الآلة الحاسبة لشركة Baoji Titanium Industry Co.، Ltd. (600456SS) ؟
- واجهة سهلة الاستخدام: مناسب لكل من المستخدمين المبتدئين وذوي الخبرة.
- المدخلات القابلة للتخصيص: قم بتعديل الافتراضات دون عناء لمطابقة تحليلك المالي.
- التقييم في الوقت الفعلي: عرض على الفور تحديثات تقييم Baoji Titanium أثناء تعديل المعلمات.
- البيانات المحملة مسبقًا: يأتي مزودًا بالمعلومات المالية التاريخية لـ Baoji Titanium لإجراء تقييمات سريعة.
- يفضله الخبراء: يستخدم على نطاق واسع من قبل المستثمرين والمحللين لاتخاذ خيارات استراتيجية.
من يجب أن ينظر في هذا المنتج؟
- المستثمرون: تقييم شركة Baoji Titanium Industry Co. ، Ltd. التقييم قبل إجراء معاملات الأسهم.
- الماليين والمحللين الماليين: تحسين سير عمل التقييم وتقييم التوقعات المالية.
- مؤسسو الشركات الناشئة: فهم طرق التقييم المستخدمة للشركات الناجحة مثل Baoji Titanium Industry Co. ، Ltd. (600456SS).
- الاستشاريون: إنشاء تقارير تقييم مفصلة لمساعدة عملائك.
- الطلاب والمعلمين: تطبيق بيانات العالم الحقيقي لتعلم وتدريس أساليب التقييم.
محتويات القالب
- نموذج DCF الشامل: قالب قابل للتحرير يتميز بحسابات تقييم شاملة.
- بيانات العالم الحقيقي: تم تحصيلها المالي التاريخي والمتوقع لشركة Baoji Titanium Industry Co. ، Ltd. (600456SS) للتحليل المتعمق.
- المعلمات القابلة للتخصيص: تعديل WACC ومعدلات النمو والافتراضات الضريبية لاستكشاف سيناريوهات مختلفة.
- البيانات المالية: الانهيار السنوي والفصلي الكامل لتصوير رؤى محسنة.
- النسب الرئيسية: التحليل المتكامل يركز على الربحية والكفاءة والاستفادة من المقاييس.
- لوحة القيادة مع المخرجات المرئية: التصورات بما في ذلك المخططات والجداول لتقديم نتائج واضحة وقابلة للتنفيذ.
Disclaimer
All information, articles, and product details provided on this website are for general informational and educational purposes only. We do not claim any ownership over, nor do we intend to infringe upon, any trademarks, copyrights, logos, brand names, or other intellectual property mentioned or depicted on this site. Such intellectual property remains the property of its respective owners, and any references here are made solely for identification or informational purposes, without implying any affiliation, endorsement, or partnership.
We make no representations or warranties, express or implied, regarding the accuracy, completeness, or suitability of any content or products presented. Nothing on this website should be construed as legal, tax, investment, financial, medical, or other professional advice. In addition, no part of this site—including articles or product references—constitutes a solicitation, recommendation, endorsement, advertisement, or offer to buy or sell any securities, franchises, or other financial instruments, particularly in jurisdictions where such activity would be unlawful.
All content is of a general nature and may not address the specific circumstances of any individual or entity. It is not a substitute for professional advice or services. Any actions you take based on the information provided here are strictly at your own risk. You accept full responsibility for any decisions or outcomes arising from your use of this website and agree to release us from any liability in connection with your use of, or reliance upon, the content or products found herein.