
|
Baoji Titanium Industry Co., Ltd. (600456.SS) Avaliação DCF |
Totalmente Editável: Adapte-Se Às Suas Necessidades No Excel Ou Planilhas
Design Profissional: Modelos Confiáveis E Padrão Da Indústria
Pré-Construídos Para Uso Rápido E Eficiente
Compatível com MAC/PC, totalmente desbloqueado
Não É Necessária Experiência; Fácil De Seguir
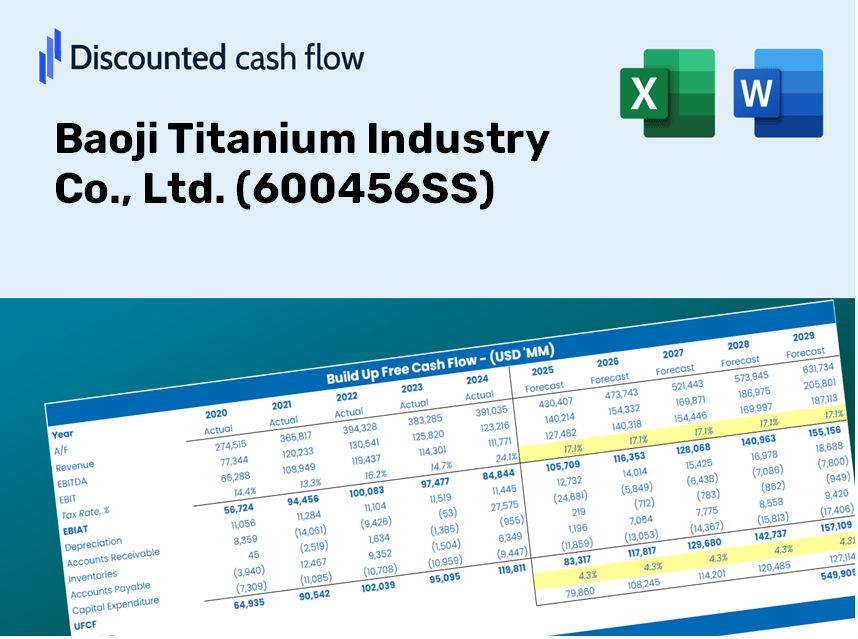
Baoji Titanium Industry Co., Ltd. (600456.SS) Bundle
Procurando avaliar o valor intrínseco da Baoji Titanium Industry Co., Ltd.? Nossa calculadora DCF (600456SS) integra dados do mundo real com extensos recursos de personalização, permitindo refinar suas previsões e aprimorar suas opções de investimento.
What You Will Receive
- Authentic BAO Titanium Financial Data: Pre-filled with Baoji Titanium's historical and projected figures for accurate analysis.
- Completely Customizable Template: Effortlessly adjust key inputs such as revenue growth, WACC, and EBITDA percentage.
- Instant Calculations: Watch the intrinsic value of Baoji Titanium update in real-time as you make changes.
- Expert Valuation Tool: Tailored for investors, analysts, and consultants in search of precise DCF outcomes.
- Intuitive Design: Streamlined layout and straightforward instructions suitable for all skill levels.
Key Features
- 🔍 Real-Life [600456SS] Financials: Pre-filled historical and projected data for Baoji Titanium Industry Co., Ltd.
- ✏️ Fully Customizable Inputs: Modify all essential parameters (yellow cells) such as WACC, growth %, and tax rates.
- 📊 Professional DCF Valuation: Integrated formulas calculate the intrinsic value of Baoji Titanium using the Discounted Cash Flow method.
- ⚡ Instant Results: View Baoji Titanium’s valuation immediately after adjustments.
- Scenario Analysis: Evaluate and compare results for various financial assumptions side by side.
How It Functions
- Step 1: Download the Excel file for Baoji Titanium Industry Co., Ltd. (600456SS).
- Step 2: Examine the pre-filled titanium data (historical and projected).
- Step 3: Modify key assumptions (highlighted in yellow) according to your analysis.
- Step 4: Observe automatic recalculations for the intrinsic value of Baoji Titanium Industry Co., Ltd. (600456SS).
- Step 5: Utilize the results for investment decisions or financial reporting.
Why Choose This Calculator for Baoji Titanium Industry Co., Ltd. (600456SS)?
- User-Friendly Interface: Suitable for both novice and experienced users.
- Customizable Inputs: Adjust assumptions effortlessly to match your financial analysis.
- Real-Time Valuation: Instantly view updates on Baoji Titanium's valuation as you modify the parameters.
- Preloaded Data: Comes equipped with Baoji Titanium's historical financial information for swift evaluations.
- Preferred by Experts: Widely utilized by investors and analysts for making strategic choices.
Who Should Consider This Product?
- Investors: Evaluate Baoji Titanium Industry Co., Ltd.'s valuation before making stock transactions.
- CFOs and Financial Analysts: Optimize valuation workflows and assess financial forecasts.
- Startup Founders: Understand the valuation methods used for successful companies like Baoji Titanium Industry Co., Ltd. (600456SS).
- Consultants: Create detailed valuation reports to assist your clients.
- Students and Educators: Apply real-world data to learn and teach valuation methods.
Contents of the Template
- Comprehensive DCF Model: Editable template featuring thorough valuation calculations.
- Real-World Data: Preloaded historical and projected financials of Baoji Titanium Industry Co., Ltd. (600456SS) for in-depth analysis.
- Customizable Parameters: Modify WACC, growth rates, and tax assumptions to explore different scenarios.
- Financial Statements: Complete annual and quarterly breakdowns for enhanced insights.
- Key Ratios: Integrated analysis focusing on profitability, efficiency, and leverage metrics.
- Dashboard with Visual Outputs: Visualizations including charts and tables to present clear, actionable results.
Disclaimer
All information, articles, and product details provided on this website are for general informational and educational purposes only. We do not claim any ownership over, nor do we intend to infringe upon, any trademarks, copyrights, logos, brand names, or other intellectual property mentioned or depicted on this site. Such intellectual property remains the property of its respective owners, and any references here are made solely for identification or informational purposes, without implying any affiliation, endorsement, or partnership.
We make no representations or warranties, express or implied, regarding the accuracy, completeness, or suitability of any content or products presented. Nothing on this website should be construed as legal, tax, investment, financial, medical, or other professional advice. In addition, no part of this site—including articles or product references—constitutes a solicitation, recommendation, endorsement, advertisement, or offer to buy or sell any securities, franchises, or other financial instruments, particularly in jurisdictions where such activity would be unlawful.
All content is of a general nature and may not address the specific circumstances of any individual or entity. It is not a substitute for professional advice or services. Any actions you take based on the information provided here are strictly at your own risk. You accept full responsibility for any decisions or outcomes arising from your use of this website and agree to release us from any liability in connection with your use of, or reliance upon, the content or products found herein.