
|
شركة Zhejiang Xinan Chemical Industrial Group ، Ltd (600596.SS) تقييم DCF |
Fully Editable: Tailor To Your Needs In Excel Or Sheets
Professional Design: Trusted, Industry-Standard Templates
Investor-Approved Valuation Models
MAC/PC Compatible, Fully Unlocked
No Expertise Is Needed; Easy To Follow
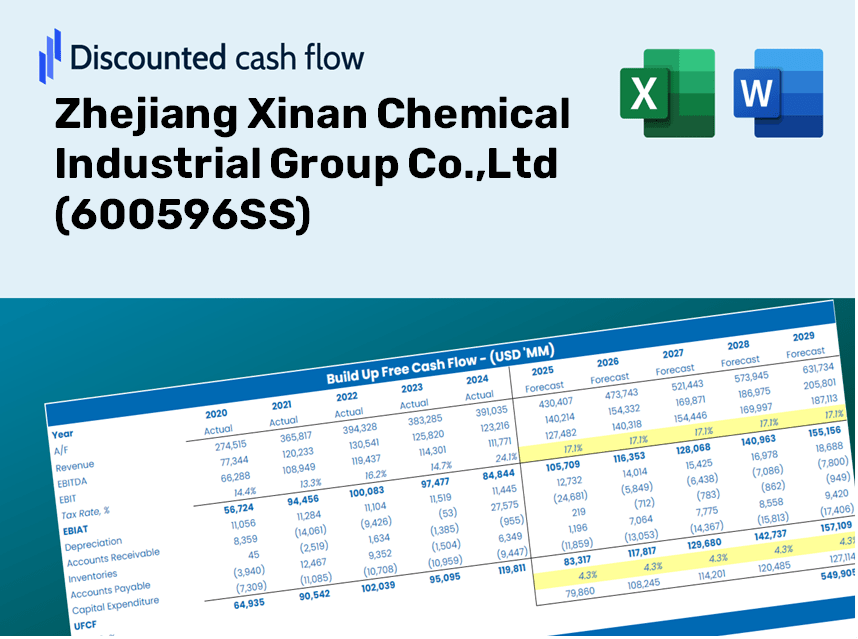
Zhejiang Xinan Chemical Industrial Group Co.,Ltd (600596.SS) Bundle
قم بتحسين وقتك وتحسين الدقة من خلال حاسبة DCF (600596SS)! باستخدام بيانات حقيقية من مجموعة Zhejiang Xinan Chemical Industrial Group ، Ltd ، إلى جانب افتراضات قابلة للتخصيص ، تمكنك هذه الأداة من التنبؤ وتحليل وتقييم قيمة (600596ss) مثل المستثمر المحنك.
Discounted Cash Flow (DCF) - (USD MM)
| Year | AY1 2020 |
AY2 2021 |
AY3 2022 |
AY4 2023 |
AY5 2024 |
FY1 2025 |
FY2 2026 |
FY3 2027 |
FY4 2028 |
FY5 2029 |
|---|---|---|---|---|---|---|---|---|---|---|
| Revenue | 12,530.0 | 18,976.7 | 21,802.7 | 14,630.2 | 14,665.4 | 15,070.6 | 15,487.0 | 15,915.0 | 16,354.7 | 16,806.6 |
| Revenue Growth, % | 0 | 51.45 | 14.89 | -32.9 | 0.24054 | 2.76 | 2.76 | 2.76 | 2.76 | 2.76 |
| EBITDA | 1,154.5 | 3,806.3 | 3,949.6 | 838.9 | 754.7 | 1,756.2 | 1,804.8 | 1,854.6 | 1,905.9 | 1,958.5 |
| EBITDA, % | 9.21 | 20.06 | 18.12 | 5.73 | 5.15 | 11.65 | 11.65 | 11.65 | 11.65 | 11.65 |
| Depreciation | 443.7 | 559.6 | 588.5 | 645.7 | 735.9 | 561.2 | 576.7 | 592.7 | 609.1 | 625.9 |
| Depreciation, % | 3.54 | 2.95 | 2.7 | 4.41 | 5.02 | 3.72 | 3.72 | 3.72 | 3.72 | 3.72 |
| EBIT | 710.8 | 3,246.7 | 3,361.1 | 193.2 | 18.8 | 1,195.0 | 1,228.0 | 1,262.0 | 1,296.8 | 1,332.7 |
| EBIT, % | 5.67 | 17.11 | 15.42 | 1.32 | 0.12795 | 7.93 | 7.93 | 7.93 | 7.93 | 7.93 |
| Total Cash | 1,598.0 | 2,364.7 | 3,589.1 | 4,286.3 | 2,538.0 | 2,660.9 | 2,734.4 | 2,809.9 | 2,887.6 | 2,967.4 |
| Total Cash, percent | .0 | .0 | .0 | .0 | .0 | .0 | .0 | .0 | .0 | .0 |
| Account Receivables | 2,158.7 | 2,897.5 | 2,211.7 | 2,159.7 | 2,300.6 | 2,203.0 | 2,263.9 | 2,326.5 | 2,390.7 | 2,456.8 |
| Account Receivables, % | 17.23 | 15.27 | 10.14 | 14.76 | 15.69 | 14.62 | 14.62 | 14.62 | 14.62 | 14.62 |
| Inventories | 1,464.3 | 2,940.4 | 2,663.3 | 2,582.1 | 2,915.9 | 2,318.7 | 2,382.8 | 2,448.6 | 2,516.3 | 2,585.8 |
| Inventories, % | 11.69 | 15.49 | 12.22 | 17.65 | 19.88 | 15.39 | 15.39 | 15.39 | 15.39 | 15.39 |
| Accounts Payable | 1,186.3 | 1,611.4 | 1,459.4 | 2,077.3 | 4,324.8 | 2,059.9 | 2,116.8 | 2,175.3 | 2,235.4 | 2,297.2 |
| Accounts Payable, % | 9.47 | 8.49 | 6.69 | 14.2 | 29.49 | 13.67 | 13.67 | 13.67 | 13.67 | 13.67 |
| Capital Expenditure | -738.9 | -848.6 | -1,379.4 | -1,511.8 | -1,606.4 | -1,144.9 | -1,176.5 | -1,209.0 | -1,242.4 | -1,276.7 |
| Capital Expenditure, % | -5.9 | -4.47 | -6.33 | -10.33 | -10.95 | -7.6 | -7.6 | -7.6 | -7.6 | -7.6 |
| Tax Rate, % | 57.61 | 57.61 | 57.61 | 57.61 | 57.61 | 57.61 | 57.61 | 57.61 | 57.61 | 57.61 |
| EBITAT | 538.4 | 2,741.9 | 2,859.5 | 85.5 | 8.0 | 793.3 | 815.2 | 837.7 | 860.9 | 884.7 |
| Depreciation | ||||||||||
| Changes in Account Receivables | ||||||||||
| Changes in Inventories | ||||||||||
| Changes in Accounts Payable | ||||||||||
| Capital Expenditure | ||||||||||
| UFCF | -2,193.6 | 663.2 | 2,879.5 | -29.7 | 910.4 | -1,360.6 | 147.4 | 151.5 | 155.7 | 160.0 |
| WACC, % | 7.25 | 7.3 | 7.31 | 7.04 | 7.03 | 7.19 | 7.19 | 7.19 | 7.19 | 7.19 |
| PV UFCF | ||||||||||
| SUM PV UFCF | -787.0 | |||||||||
| Long Term Growth Rate, % | 0.50 | |||||||||
| Free cash flow (T + 1) | 161 | |||||||||
| Terminal Value | 2,405 | |||||||||
| Present Terminal Value | 1,700 | |||||||||
| Enterprise Value | 913 | |||||||||
| Net Debt | 351 | |||||||||
| Equity Value | 562 | |||||||||
| Diluted Shares Outstanding, MM | 1,285 | |||||||||
| Equity Value Per Share | 0.44 |
ما ستناله
- النموذج المالي الشامل: الاستفادة من البيانات الحقيقية لشركة Zhejiang Xinan Chemical لتقييم DCF الدقيق.
- التحكم الكامل في التنبؤ: قم بتعديل نمو الإيرادات وهوامش الربح و WACC والعوامل الحاسمة الأخرى وفقًا لتقديرك.
- حسابات الوقت الفعلي: توفر التحديثات التلقائية ملاحظات فورية أثناء ضبط مدخلاتك.
- نموذج الدرجة المهنية: ملف Excel متقدم مصمم للتقييم المالي عالي الجودة.
- مرنة وقابلة لإعادة الاستخدام: مصممة للتكيف، مما يسمح بالتطبيق المتكرر في التنبؤ التفصيلي.
الميزات الرئيسية
- 🔍 واقعية 600596SS المالية: بيانات تاريخية ومتوقعة شاملة لشركة Zhejiang Xinan Chemical Industrial Group ، Ltd.
- ✏️ مدخلات قابلة للتخصيص بالكامل: تخصيص جميع المعلمات الأساسية (الخلايا الصفراء) مثل WACC و Growth ٪ ومعدلات الضرائب.
- 📊 تقييم DCF المهني: تحدد الصيغ المتكاملة القيمة الجوهرية لـ Zhejiang Xinan باستخدام طريقة التدفق النقدي المخفض.
- ⚡ النتائج الفورية: انظر تحديث تقييم Zhejiang Xinan مباشرة بعد التعديلات.
- تحليل السيناريو: تقييم ومقارنة النتائج المختلفة بناءً على افتراضات مالية مختلفة جنبًا إلى جنب.
كيف يعمل
- الخطوة 1: قم بتنزيل ملف Excel لشركة Zhejiang Xinan Chemical Industrial Group Co.، Ltd (600596SS).
- الخطوة 2: فحص البيانات والتوقعات المالية المعبأة مسبقًا للشركة.
- الخطوة 3: تعديل المتغيرات الرئيسية مثل نمو الإيرادات و WACC ومعدلات الضرائب (الخلايا المميزة).
- الخطوة 4: راقب تحديث نموذج DCF في الوقت الفعلي أثناء تعديل افتراضاتك.
- الخطوة 5: تقييم الناتج واستخدام النتائج في خيارات الاستثمار المستنيرة.
لماذا تختار هذه الآلة الحاسبة؟
- تصميم سهل الاستخدام: مثالي لكل من المبتدئين والمهنيين المتمرسين.
- مدخلات قابلة للتخصيص: تعديل المعلمات دون عناء لتخصيص تحليلك.
- تحديثات الوقت الحقيقي: لاحظ التغييرات الفورية في تقييم Zhejiang Xinan Chemical أثناء تعديل المدخلات.
- تم تكوينه مسبقًا: يأتي مسبقًا مع البيانات المالية الفعلية لـ Zhejiang Xinan Chemical للتقييمات السريعة.
- يفضله الخبراء: يستخدم على نطاق واسع من قبل المستثمرين والمحللين لاتخاذ القرارات المطلعين.
من يمكنه الاستفادة من هذا المنتج؟
- المستثمرون: تقييم تقييم شركة Zhejiang Xinan Chemical Industrial Group ، Ltd (600596SS) قبل إجراء معاملات الأسهم.
- الماليين والمحللين الماليين: تحسين منهجيات التقييم وتقييم التوقعات المالية.
- مؤسسو الشركات الناشئة: اكتساب نظرة ثاقبة على كيفية تقدير الشركات الرائدة في الشركات العامة مثل Zhejiang Xinan Chemical.
- الاستشاريون: إنتاج تقارير تقييم شاملة لمختلف العملاء.
- الطلاب والمعلمين: تطبيق دراسات الحالة في العالم الحقيقي لتعلم وتعليم استراتيجيات التقييم.
ما يتضمنه القالب
- نموذج DCF المليء مسبقًا: تم التحميل مسبقًا للبيانات المالية لـ Zhejiang Xinan Chemical للتحليل الفوري.
- حاسبة WACC: حسابات شاملة لمتوسط تكلفة رأس المال المرجح.
- النسب المالية: تقييم ربحية Zhejiang Xinan Chemical والرافعة المالية والكفاءة التشغيلية.
- مدخلات قابلة للتحرير: تعديل الافتراضات مثل معدلات النمو وهامش الربح و Capex لتناسب احتياجاتك.
- البيانات المالية: الوصول إلى التقارير السنوية والفصلية للفحص المالي المتعمق.
- لوحة القيادة التفاعلية: تصور دون عناء مقاييس ونتائج التقييم الأساسية.
Disclaimer
All information, articles, and product details provided on this website are for general informational and educational purposes only. We do not claim any ownership over, nor do we intend to infringe upon, any trademarks, copyrights, logos, brand names, or other intellectual property mentioned or depicted on this site. Such intellectual property remains the property of its respective owners, and any references here are made solely for identification or informational purposes, without implying any affiliation, endorsement, or partnership.
We make no representations or warranties, express or implied, regarding the accuracy, completeness, or suitability of any content or products presented. Nothing on this website should be construed as legal, tax, investment, financial, medical, or other professional advice. In addition, no part of this site—including articles or product references—constitutes a solicitation, recommendation, endorsement, advertisement, or offer to buy or sell any securities, franchises, or other financial instruments, particularly in jurisdictions where such activity would be unlawful.
All content is of a general nature and may not address the specific circumstances of any individual or entity. It is not a substitute for professional advice or services. Any actions you take based on the information provided here are strictly at your own risk. You accept full responsibility for any decisions or outcomes arising from your use of this website and agree to release us from any liability in connection with your use of, or reliance upon, the content or products found herein.