
|
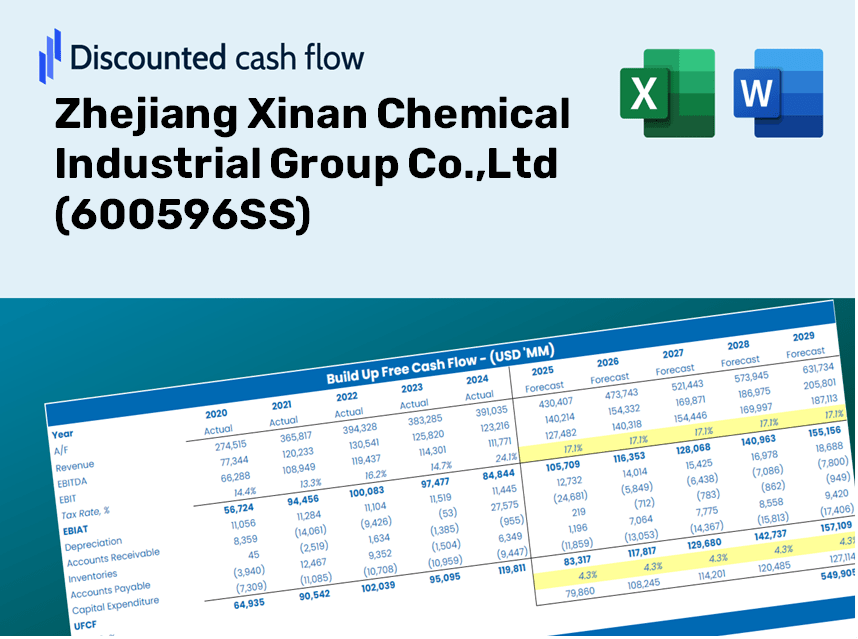
Zhejiang Xinan Chemical Industrial Group Co., Ltd (600596.SS) DCF -Bewertung |
Fully Editable: Tailor To Your Needs In Excel Or Sheets
Professional Design: Trusted, Industry-Standard Templates
Investor-Approved Valuation Models
MAC/PC Compatible, Fully Unlocked
No Expertise Is Needed; Easy To Follow
Zhejiang Xinan Chemical Industrial Group Co.,Ltd (600596.SS) Bundle
Optimieren Sie Ihre Zeit und verbessern Sie die Präzision mit unserem DCF -Taschenrechner (600596S)! Mit diesem Tool werden reale Daten von Zhejiang Xinan Chemical Industrial Group Co., Ltd und anpassbare Annahmen verwendet und können den Wert von (600596SS) wie ein erfahrener Investor prognostizieren, analysieren und bewerten.
Discounted Cash Flow (DCF) - (USD MM)
| Year | AY1 2020 |
AY2 2021 |
AY3 2022 |
AY4 2023 |
AY5 2024 |
FY1 2025 |
FY2 2026 |
FY3 2027 |
FY4 2028 |
FY5 2029 |
|---|---|---|---|---|---|---|---|---|---|---|
| Revenue | 12,530.0 | 18,976.7 | 21,802.7 | 14,630.2 | 14,665.4 | 15,070.6 | 15,487.0 | 15,915.0 | 16,354.7 | 16,806.6 |
| Revenue Growth, % | 0 | 51.45 | 14.89 | -32.9 | 0.24054 | 2.76 | 2.76 | 2.76 | 2.76 | 2.76 |
| EBITDA | 1,154.5 | 3,806.3 | 3,949.6 | 838.9 | 754.7 | 1,756.2 | 1,804.8 | 1,854.6 | 1,905.9 | 1,958.5 |
| EBITDA, % | 9.21 | 20.06 | 18.12 | 5.73 | 5.15 | 11.65 | 11.65 | 11.65 | 11.65 | 11.65 |
| Depreciation | 443.7 | 559.6 | 588.5 | 645.7 | 735.9 | 561.2 | 576.7 | 592.7 | 609.1 | 625.9 |
| Depreciation, % | 3.54 | 2.95 | 2.7 | 4.41 | 5.02 | 3.72 | 3.72 | 3.72 | 3.72 | 3.72 |
| EBIT | 710.8 | 3,246.7 | 3,361.1 | 193.2 | 18.8 | 1,195.0 | 1,228.0 | 1,262.0 | 1,296.8 | 1,332.7 |
| EBIT, % | 5.67 | 17.11 | 15.42 | 1.32 | 0.12795 | 7.93 | 7.93 | 7.93 | 7.93 | 7.93 |
| Total Cash | 1,598.0 | 2,364.7 | 3,589.1 | 4,286.3 | 2,538.0 | 2,660.9 | 2,734.4 | 2,809.9 | 2,887.6 | 2,967.4 |
| Total Cash, percent | .0 | .0 | .0 | .0 | .0 | .0 | .0 | .0 | .0 | .0 |
| Account Receivables | 2,158.7 | 2,897.5 | 2,211.7 | 2,159.7 | 2,300.6 | 2,203.0 | 2,263.9 | 2,326.5 | 2,390.7 | 2,456.8 |
| Account Receivables, % | 17.23 | 15.27 | 10.14 | 14.76 | 15.69 | 14.62 | 14.62 | 14.62 | 14.62 | 14.62 |
| Inventories | 1,464.3 | 2,940.4 | 2,663.3 | 2,582.1 | 2,915.9 | 2,318.7 | 2,382.8 | 2,448.6 | 2,516.3 | 2,585.8 |
| Inventories, % | 11.69 | 15.49 | 12.22 | 17.65 | 19.88 | 15.39 | 15.39 | 15.39 | 15.39 | 15.39 |
| Accounts Payable | 1,186.3 | 1,611.4 | 1,459.4 | 2,077.3 | 4,324.8 | 2,059.9 | 2,116.8 | 2,175.3 | 2,235.4 | 2,297.2 |
| Accounts Payable, % | 9.47 | 8.49 | 6.69 | 14.2 | 29.49 | 13.67 | 13.67 | 13.67 | 13.67 | 13.67 |
| Capital Expenditure | -738.9 | -848.6 | -1,379.4 | -1,511.8 | -1,606.4 | -1,144.9 | -1,176.5 | -1,209.0 | -1,242.4 | -1,276.7 |
| Capital Expenditure, % | -5.9 | -4.47 | -6.33 | -10.33 | -10.95 | -7.6 | -7.6 | -7.6 | -7.6 | -7.6 |
| Tax Rate, % | 57.61 | 57.61 | 57.61 | 57.61 | 57.61 | 57.61 | 57.61 | 57.61 | 57.61 | 57.61 |
| EBITAT | 538.4 | 2,741.9 | 2,859.5 | 85.5 | 8.0 | 793.3 | 815.2 | 837.7 | 860.9 | 884.7 |
| Depreciation | ||||||||||
| Changes in Account Receivables | ||||||||||
| Changes in Inventories | ||||||||||
| Changes in Accounts Payable | ||||||||||
| Capital Expenditure | ||||||||||
| UFCF | -2,193.6 | 663.2 | 2,879.5 | -29.7 | 910.4 | -1,360.6 | 147.4 | 151.5 | 155.7 | 160.0 |
| WACC, % | 7.25 | 7.3 | 7.31 | 7.04 | 7.03 | 7.19 | 7.19 | 7.19 | 7.19 | 7.19 |
| PV UFCF | ||||||||||
| SUM PV UFCF | -787.0 | |||||||||
| Long Term Growth Rate, % | 0.50 | |||||||||
| Free cash flow (T + 1) | 161 | |||||||||
| Terminal Value | 2,405 | |||||||||
| Present Terminal Value | 1,700 | |||||||||
| Enterprise Value | 913 | |||||||||
| Net Debt | 351 | |||||||||
| Equity Value | 562 | |||||||||
| Diluted Shares Outstanding, MM | 1,285 | |||||||||
| Equity Value Per Share | 0.44 |
What You Will Receive
- Comprehensive Financial Model: Leverage Zhejiang Xinan Chemical’s real data for accurate DCF valuation.
- Complete Forecast Control: Modify revenue growth, profit margins, WACC, and other critical factors at your discretion.
- Real-Time Calculations: Automatic updates provide immediate feedback as you adjust your inputs.
- Professional-Grade Template: An advanced Excel file crafted for high-quality financial valuation.
- Flexible and Reusable: Designed for adaptability, allowing for repeated application in detailed forecasting.
Key Features
- 🔍 Real-Life 600596SS Financials: Comprehensive historical and projected data for Zhejiang Xinan Chemical Industrial Group Co., Ltd.
- ✏️ Fully Customizable Inputs: Tailor all essential parameters (yellow cells) such as WACC, growth %, and tax rates.
- 📊 Professional DCF Valuation: Integrated formulas determine Zhejiang Xinan’s intrinsic value using the Discounted Cash Flow method.
- ⚡ Instant Results: See Zhejiang Xinan’s valuation update immediately after adjustments.
- Scenario Analysis: Evaluate and compare different outcomes based on various financial assumptions side-by-side.
How It Works
- Step 1: Download the Excel file for Zhejiang Xinan Chemical Industrial Group Co.,Ltd (600596SS).
- Step 2: Examine the pre-filled financial data and projections for the company.
- Step 3: Adjust key variables such as revenue growth, WACC, and tax rates (highlighted cells).
- Step 4: Observe the DCF model update in real-time as you modify your assumptions.
- Step 5: Evaluate the output and utilize the findings for informed investment choices.
Why Opt for This Calculator?
- User-Friendly Design: Perfect for both novices and seasoned professionals.
- Customizable Inputs: Effortlessly adjust parameters to tailor your analysis.
- Real-Time Updates: Observe immediate changes in Zhejiang Xinan Chemical's valuation as you modify inputs.
- Pre-Configured: Comes preloaded with Zhejiang Xinan Chemical's actual financial data for swift assessments.
- Preferred by Experts: Widely used by investors and analysts for well-informed decision-making.
Who Can Benefit from This Product?
- Investors: Evaluate the valuation of Zhejiang Xinan Chemical Industrial Group Co., Ltd (600596SS) before making stock transactions.
- CFOs and Financial Analysts: Optimize valuation methodologies and assess financial projections.
- Startup Founders: Gain insights into how leading public firms like Zhejiang Xinan Chemical are valued.
- Consultants: Produce comprehensive valuation reports for various clients.
- Students and Educators: Apply real-world case studies to learn and teach valuation strategies.
What the Template Includes
- Pre-Filled DCF Model: Zhejiang Xinan Chemical's financial data preloaded for immediate analysis.
- WACC Calculator: Comprehensive calculations for the Weighted Average Cost of Capital.
- Financial Ratios: Assess Zhejiang Xinan Chemical's profitability, leverage, and operational efficiency.
- Editable Inputs: Modify assumptions such as growth rates, profit margins, and CAPEX to suit your needs.
- Financial Statements: Access annual and quarterly reports for in-depth financial examination.
- Interactive Dashboard: Effortlessly visualize essential valuation metrics and outcomes.
Disclaimer
All information, articles, and product details provided on this website are for general informational and educational purposes only. We do not claim any ownership over, nor do we intend to infringe upon, any trademarks, copyrights, logos, brand names, or other intellectual property mentioned or depicted on this site. Such intellectual property remains the property of its respective owners, and any references here are made solely for identification or informational purposes, without implying any affiliation, endorsement, or partnership.
We make no representations or warranties, express or implied, regarding the accuracy, completeness, or suitability of any content or products presented. Nothing on this website should be construed as legal, tax, investment, financial, medical, or other professional advice. In addition, no part of this site—including articles or product references—constitutes a solicitation, recommendation, endorsement, advertisement, or offer to buy or sell any securities, franchises, or other financial instruments, particularly in jurisdictions where such activity would be unlawful.
All content is of a general nature and may not address the specific circumstances of any individual or entity. It is not a substitute for professional advice or services. Any actions you take based on the information provided here are strictly at your own risk. You accept full responsibility for any decisions or outcomes arising from your use of this website and agree to release us from any liability in connection with your use of, or reliance upon, the content or products found herein.