
|
شركة Shaanxi Beiyuan Chemical Industry Group ، Ltd. (601568.SS) تقييم DCF |
Fully Editable: Tailor To Your Needs In Excel Or Sheets
Professional Design: Trusted, Industry-Standard Templates
Investor-Approved Valuation Models
MAC/PC Compatible, Fully Unlocked
No Expertise Is Needed; Easy To Follow
Shaanxi Beiyuan Chemical Industry Group Co., Ltd. (601568.SS) Bundle
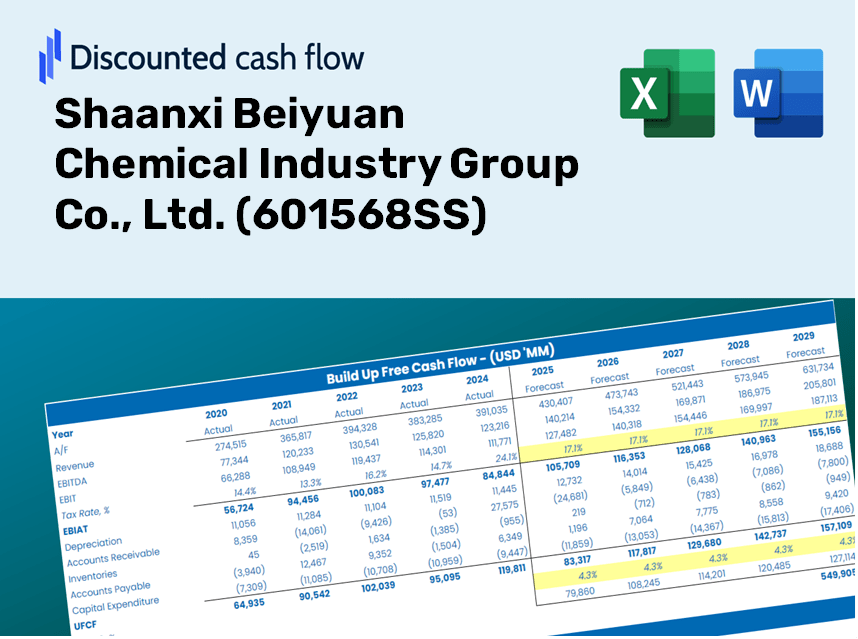
اكتساب نظرة ثاقبة على تحليل التقييم Shaanxi Beiyuan Chemical Industry Group ، Ltd. (601568SS) مع حاسبة DCF الحديثة لدينا! يأتي قالب Excel هذا مسبقًا ببيانات حقيقية (601568SS) ، مما يتيح لك ضبط التوقعات والافتراضات لتحديد القيمة الجوهرية لمجموعة Shanxi Beiyuan Chemical Industry Group ، Ltd.
Discounted Cash Flow (DCF) - (USD MM)
| Year | AY1 2020 |
AY2 2021 |
AY3 2022 |
AY4 2023 |
AY5 2024 |
FY1 2025 |
FY2 2026 |
FY3 2027 |
FY4 2028 |
FY5 2029 |
|---|---|---|---|---|---|---|---|---|---|---|
| Revenue | 9,853.5 | 13,153.8 | 12,589.6 | 10,966.5 | 10,078.2 | 10,639.6 | 11,232.2 | 11,857.8 | 12,518.3 | 13,215.6 |
| Revenue Growth, % | 0 | 33.49 | -4.29 | -12.89 | -8.1 | 5.57 | 5.57 | 5.57 | 5.57 | 5.57 |
| EBITDA | 2,682.4 | 2,909.7 | 2,312.6 | 1,109.4 | 1,027.7 | 1,873.1 | 1,977.5 | 2,087.6 | 2,203.9 | 2,326.7 |
| EBITDA, % | 27.22 | 22.12 | 18.37 | 10.12 | 10.2 | 17.61 | 17.61 | 17.61 | 17.61 | 17.61 |
| Depreciation | 681.3 | 703.5 | 709.0 | 682.7 | 692.4 | 659.4 | 696.2 | 734.9 | 775.9 | 819.1 |
| Depreciation, % | 6.91 | 5.35 | 5.63 | 6.23 | 6.87 | 6.2 | 6.2 | 6.2 | 6.2 | 6.2 |
| EBIT | 2,001.1 | 2,206.3 | 1,603.6 | 426.7 | 335.3 | 1,213.7 | 1,281.3 | 1,352.7 | 1,428.0 | 1,507.6 |
| EBIT, % | 20.31 | 16.77 | 12.74 | 3.89 | 3.33 | 11.41 | 11.41 | 11.41 | 11.41 | 11.41 |
| Total Cash | 4,502.5 | 6,604.8 | 7,027.5 | 4,632.5 | 4,563.9 | 5,091.1 | 5,374.7 | 5,674.0 | 5,990.1 | 6,323.7 |
| Total Cash, percent | .0 | .0 | .0 | .0 | .0 | .0 | .0 | .0 | .0 | .0 |
| Account Receivables | 2,274.6 | 1,899.7 | 1,180.1 | 1,171.5 | 450.2 | 1,320.4 | 1,393.9 | 1,471.5 | 1,553.5 | 1,640.0 |
| Account Receivables, % | 23.08 | 14.44 | 9.37 | 10.68 | 4.47 | 12.41 | 12.41 | 12.41 | 12.41 | 12.41 |
| Inventories | 469.6 | 566.3 | 762.9 | 486.1 | 325.0 | 484.9 | 511.9 | 540.5 | 570.6 | 602.3 |
| Inventories, % | 4.77 | 4.31 | 6.06 | 4.43 | 3.22 | 4.56 | 4.56 | 4.56 | 4.56 | 4.56 |
| Accounts Payable | 1,561.0 | 2,382.9 | 2,148.5 | 953.4 | 1,915.7 | 1,675.2 | 1,768.5 | 1,867.0 | 1,971.0 | 2,080.8 |
| Accounts Payable, % | 15.84 | 18.12 | 17.07 | 8.69 | 19.01 | 15.75 | 15.75 | 15.75 | 15.75 | 15.75 |
| Capital Expenditure | -46.7 | -63.1 | -105.9 | -559.5 | -690.1 | -292.5 | -308.7 | -325.9 | -344.1 | -363.3 |
| Capital Expenditure, % | -0.47363 | -0.47933 | -0.84147 | -5.1 | -6.85 | -2.75 | -2.75 | -2.75 | -2.75 | -2.75 |
| Tax Rate, % | 30.23 | 30.23 | 30.23 | 30.23 | 30.23 | 30.23 | 30.23 | 30.23 | 30.23 | 30.23 |
| EBITAT | 1,710.5 | 1,851.6 | 1,446.7 | 374.0 | 233.9 | 1,012.3 | 1,068.7 | 1,128.2 | 1,191.0 | 1,257.4 |
| Depreciation | ||||||||||
| Changes in Account Receivables | ||||||||||
| Changes in Inventories | ||||||||||
| Changes in Accounts Payable | ||||||||||
| Capital Expenditure | ||||||||||
| UFCF | 1,162.0 | 3,592.0 | 2,338.4 | -412.6 | 2,081.0 | 108.6 | 1,448.8 | 1,529.5 | 1,614.7 | 1,704.7 |
| WACC, % | 4.66 | 4.66 | 4.67 | 4.67 | 4.66 | 4.66 | 4.66 | 4.66 | 4.66 | 4.66 |
| PV UFCF | ||||||||||
| SUM PV UFCF | 5,463.2 | |||||||||
| Long Term Growth Rate, % | 2.00 | |||||||||
| Free cash flow (T + 1) | 1,739 | |||||||||
| Terminal Value | 65,261 | |||||||||
| Present Terminal Value | 51,959 | |||||||||
| Enterprise Value | 57,422 | |||||||||
| Net Debt | -4,483 | |||||||||
| Equity Value | 61,905 | |||||||||
| Diluted Shares Outstanding, MM | 3,848 | |||||||||
| Equity Value Per Share | 16.09 |
ماذا ستتلقى
- البيانات المالية 601568SS الأصلية: تم تحميله مسبقًا مع أرقام Shaanxi Beiyuan Chemical التاريخية والمتوقعة للتحليل الدقيق.
- قالب قابل للتخصيص تمامًا: بسهولة ضبط المدخلات الرئيسية مثل نمو الإيرادات و WACC و EBITDA ٪.
- الحسابات الفورية: شاهد القيمة الجوهرية لتحديث Shaanxi Beiyuan الكيميائي تلقائيًا بناءً على مدخلاتك.
- أداة التقييم المتقدمة: مصمم للمستثمرين والمحللين والمستشارين الذين يهدفون إلى نتائج DCF دقيقة.
- تصميم بديهي: تخطيط واضح والإرشادات المباشرة مناسبة لجميع مستويات المهارة.
الميزات الرئيسية
- البيانات التي تم تحميلها مسبقًا: الوصول إلى شركة Shaanxi Beiyuan Chemical Industry Group ، Ltd. ، البيانات المالية التاريخية والتوقعات المليئة مسبقًا.
- مدخلات قابلة للتعديل بالكامل: تخصيص WACC ، ومعدلات الضرائب ، ونمو الإيرادات ، وهامش الأرباح قبل الفوائد والضرائب والإهلاك والاستهلاك.
- النتائج الفورية: شاهد القيمة الجوهرية لتحديث Shaanxi Beiyuan Chemical Industry Group Co. ، Ltd. (601568SS) في الوقت الفعلي.
- واضحة المخرجات المرئية: تقدم مخططات لوحة القيادة نتائج التقييم والمقاييس الأساسية بوضوح.
- بنيت للدقة: أداة من الدرجة المهنية المصممة للمحللين والمستثمرين والمهنيين الماليين.
كيف تعمل
- الخطوة 1: قم بتنزيل ملف Excel.
- الخطوة 2: راجع البيانات المسبقة قبل الدخول لشركة Shaanxi Beiyuan Chemical Industry Group Co. ، Ltd. (601568ss).
- الخطوة 3: تعديل الافتراضات الرئيسية (الخلايا الصفراء) وفقا لتحليلك.
- الخطوة 4: راقب عمليات إعادة الحساب التلقائية للقيمة الجوهرية لشركة Shaanxi Beiyuan Chemical Industry Group Co. ، Ltd. (601568SS).
- الخطوة 5: الاستفادة من نتائج قرارات الاستثمار الخاصة بك أو احتياجات الإبلاغ.
لماذا تختار حلول شنشي بييوان؟
- توفير الوقت: تخطي متاعب بناء نماذج من نقطة الصفر - أدواتنا جاهزة على الفور للاستخدام.
- الدقة المعززة: بياناتنا المالية التي يمكن الاعتماد عليها تقلل من أخطاء التقييم.
- قابلة للتخصيص تماما: تكييف النماذج لتناسب افتراضاتك الفريدة والتوقعات.
- سهل الاستخدام: تضمن المخططات والمخرجات البديهية أن تكون النتائج واضحة للتفسير.
- يفضله المهنيون: تم تصميمه لخبراء الصناعة الذين يعطون الأولوية للدقة وسهولة الاستخدام.
من يجب أن يستخدم هذا المنتج؟
- المستثمرون المؤسسيون: قم بتطوير نماذج تقييم شاملة يمكن الاعتماد عليها لتقييم الاستثمارات في مجموعة Shaanxi Beiyuan Chemical Industry Group ، Ltd. (601568SS).
- إدارات تمويل الشركات: تقييم سيناريوهات التقييم لإبلاغ القرارات الاستراتيجية داخل شركاتهم.
- المستشارون والمستشارون الماليون: قدم للعملاء تحليل تقييم دقيق لشركة Shaanxi Beiyuan Chemical Industry Group Co. ، Ltd. (601568ss).
- الأكاديميون والطلاب: الاستفادة من بيانات السوق الحقيقية لتعزيز التعلم والممارسة في النمذجة المالية.
- عشاق الصناعة الكيميائية: اكتساب نظرة ثاقبة على كيفية تقدير شركات مثل Shaanxi Beiyuan Chemical Industry Group Co. ، Ltd. (601568ss) داخل الصناعة.
ما يحتويه القالب
- نموذج DCF المليء مسبقًا: تم التحميل مسبقًا للبيانات المالية لشركة Shaanxi Beiyuan Chemical للتحليل الفوري.
- حاسبة WACC: حسابات شاملة لمتوسط تكلفة رأس المال المرجح.
- النسب المالية: تقييم الربحية والرافعة والرافعة والكفاءة التشغيلية لـ Shaanxi Beiyuan Chemical.
- مدخلات قابلة للتحرير: تعديل الافتراضات مثل معدلات النمو والهوامش و Capex لتناسب تحليلك.
- البيانات المالية: تقارير سنوية وفصلية لتسهيل التقييم الشامل.
- لوحة القيادة التفاعلية: تصور دون عناء مقاييس التقييم الرئيسية والنتائج.
Disclaimer
All information, articles, and product details provided on this website are for general informational and educational purposes only. We do not claim any ownership over, nor do we intend to infringe upon, any trademarks, copyrights, logos, brand names, or other intellectual property mentioned or depicted on this site. Such intellectual property remains the property of its respective owners, and any references here are made solely for identification or informational purposes, without implying any affiliation, endorsement, or partnership.
We make no representations or warranties, express or implied, regarding the accuracy, completeness, or suitability of any content or products presented. Nothing on this website should be construed as legal, tax, investment, financial, medical, or other professional advice. In addition, no part of this site—including articles or product references—constitutes a solicitation, recommendation, endorsement, advertisement, or offer to buy or sell any securities, franchises, or other financial instruments, particularly in jurisdictions where such activity would be unlawful.
All content is of a general nature and may not address the specific circumstances of any individual or entity. It is not a substitute for professional advice or services. Any actions you take based on the information provided here are strictly at your own risk. You accept full responsibility for any decisions or outcomes arising from your use of this website and agree to release us from any liability in connection with your use of, or reliance upon, the content or products found herein.