
|
Shaanxi Beiyuan Chemical Industry Group Co., Ltd. (601568.SS) DCF -Bewertung |
Fully Editable: Tailor To Your Needs In Excel Or Sheets
Professional Design: Trusted, Industry-Standard Templates
Investor-Approved Valuation Models
MAC/PC Compatible, Fully Unlocked
No Expertise Is Needed; Easy To Follow
Shaanxi Beiyuan Chemical Industry Group Co., Ltd. (601568.SS) Bundle
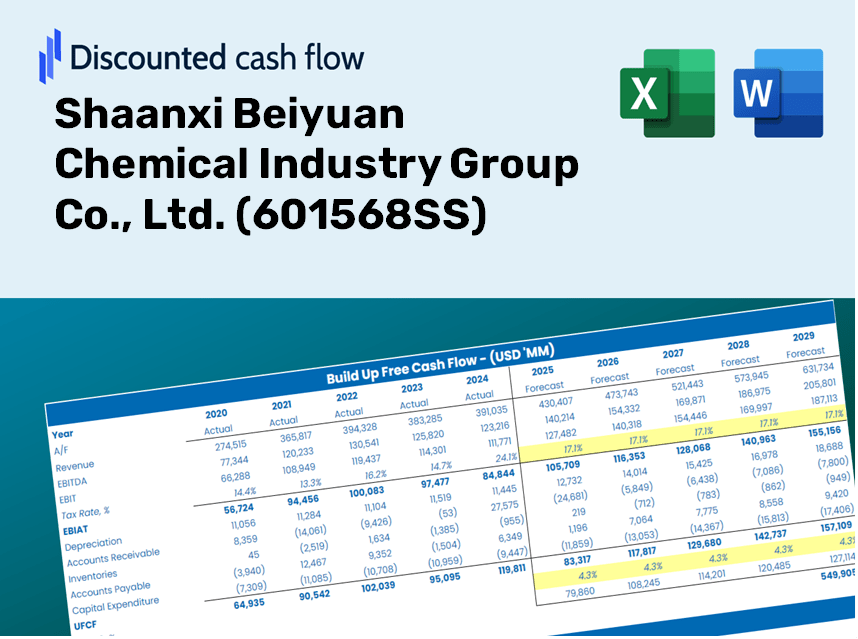
Gewinnen Sie Einblicke in Ihre Shaanxi Beiyuan Chemical Industry Group Co., Ltd. (601568SS) Bewertungsanalyse mit unserem hochmodernen DCF-Taschenrechner! Diese Excel -Vorlage wird mit realen (601568S) Daten vorinstalliert, sodass Sie Prognosen und Annahmen anpassen können, um den inneren Wert von Shaanxi Beiyuan Chemical Industry Group Co., Ltd. genau zu bestimmen.
Discounted Cash Flow (DCF) - (USD MM)
| Year | AY1 2020 |
AY2 2021 |
AY3 2022 |
AY4 2023 |
AY5 2024 |
FY1 2025 |
FY2 2026 |
FY3 2027 |
FY4 2028 |
FY5 2029 |
|---|---|---|---|---|---|---|---|---|---|---|
| Revenue | 9,853.5 | 13,153.8 | 12,589.6 | 10,966.5 | 10,078.2 | 10,639.6 | 11,232.2 | 11,857.8 | 12,518.3 | 13,215.6 |
| Revenue Growth, % | 0 | 33.49 | -4.29 | -12.89 | -8.1 | 5.57 | 5.57 | 5.57 | 5.57 | 5.57 |
| EBITDA | 2,682.4 | 2,909.7 | 2,312.6 | 1,109.4 | 1,027.7 | 1,873.1 | 1,977.5 | 2,087.6 | 2,203.9 | 2,326.7 |
| EBITDA, % | 27.22 | 22.12 | 18.37 | 10.12 | 10.2 | 17.61 | 17.61 | 17.61 | 17.61 | 17.61 |
| Depreciation | 681.3 | 703.5 | 709.0 | 682.7 | 692.4 | 659.4 | 696.2 | 734.9 | 775.9 | 819.1 |
| Depreciation, % | 6.91 | 5.35 | 5.63 | 6.23 | 6.87 | 6.2 | 6.2 | 6.2 | 6.2 | 6.2 |
| EBIT | 2,001.1 | 2,206.3 | 1,603.6 | 426.7 | 335.3 | 1,213.7 | 1,281.3 | 1,352.7 | 1,428.0 | 1,507.6 |
| EBIT, % | 20.31 | 16.77 | 12.74 | 3.89 | 3.33 | 11.41 | 11.41 | 11.41 | 11.41 | 11.41 |
| Total Cash | 4,502.5 | 6,604.8 | 7,027.5 | 4,632.5 | 4,563.9 | 5,091.1 | 5,374.7 | 5,674.0 | 5,990.1 | 6,323.7 |
| Total Cash, percent | .0 | .0 | .0 | .0 | .0 | .0 | .0 | .0 | .0 | .0 |
| Account Receivables | 2,274.6 | 1,899.7 | 1,180.1 | 1,171.5 | 450.2 | 1,320.4 | 1,393.9 | 1,471.5 | 1,553.5 | 1,640.0 |
| Account Receivables, % | 23.08 | 14.44 | 9.37 | 10.68 | 4.47 | 12.41 | 12.41 | 12.41 | 12.41 | 12.41 |
| Inventories | 469.6 | 566.3 | 762.9 | 486.1 | 325.0 | 484.9 | 511.9 | 540.5 | 570.6 | 602.3 |
| Inventories, % | 4.77 | 4.31 | 6.06 | 4.43 | 3.22 | 4.56 | 4.56 | 4.56 | 4.56 | 4.56 |
| Accounts Payable | 1,561.0 | 2,382.9 | 2,148.5 | 953.4 | 1,915.7 | 1,675.2 | 1,768.5 | 1,867.0 | 1,971.0 | 2,080.8 |
| Accounts Payable, % | 15.84 | 18.12 | 17.07 | 8.69 | 19.01 | 15.75 | 15.75 | 15.75 | 15.75 | 15.75 |
| Capital Expenditure | -46.7 | -63.1 | -105.9 | -559.5 | -690.1 | -292.5 | -308.7 | -325.9 | -344.1 | -363.3 |
| Capital Expenditure, % | -0.47363 | -0.47933 | -0.84147 | -5.1 | -6.85 | -2.75 | -2.75 | -2.75 | -2.75 | -2.75 |
| Tax Rate, % | 30.23 | 30.23 | 30.23 | 30.23 | 30.23 | 30.23 | 30.23 | 30.23 | 30.23 | 30.23 |
| EBITAT | 1,710.5 | 1,851.6 | 1,446.7 | 374.0 | 233.9 | 1,012.3 | 1,068.7 | 1,128.2 | 1,191.0 | 1,257.4 |
| Depreciation | ||||||||||
| Changes in Account Receivables | ||||||||||
| Changes in Inventories | ||||||||||
| Changes in Accounts Payable | ||||||||||
| Capital Expenditure | ||||||||||
| UFCF | 1,162.0 | 3,592.0 | 2,338.4 | -412.6 | 2,081.0 | 108.6 | 1,448.8 | 1,529.5 | 1,614.7 | 1,704.7 |
| WACC, % | 4.66 | 4.66 | 4.67 | 4.67 | 4.66 | 4.66 | 4.66 | 4.66 | 4.66 | 4.66 |
| PV UFCF | ||||||||||
| SUM PV UFCF | 5,463.2 | |||||||||
| Long Term Growth Rate, % | 2.00 | |||||||||
| Free cash flow (T + 1) | 1,739 | |||||||||
| Terminal Value | 65,261 | |||||||||
| Present Terminal Value | 51,959 | |||||||||
| Enterprise Value | 57,422 | |||||||||
| Net Debt | -4,483 | |||||||||
| Equity Value | 61,905 | |||||||||
| Diluted Shares Outstanding, MM | 3,848 | |||||||||
| Equity Value Per Share | 16.09 |
What You Will Receive
- Authentic 601568SS Financial Data: Pre-loaded with Shaanxi Beiyuan Chemical’s historical and projected figures for accurate analysis.
- Completely Customizable Template: Easily adjust key inputs such as revenue growth, WACC, and EBITDA %.
- Instant Calculations: Watch the intrinsic value of Shaanxi Beiyuan Chemical update automatically based on your inputs.
- Advanced Valuation Tool: Tailored for investors, analysts, and consultants aiming for precise DCF outcomes.
- Intuitive Design: Clear layout and straightforward guidance suitable for all skill levels.
Key Features
- Pre-Loaded Data: Access to Shaanxi Beiyuan Chemical Industry Group Co., Ltd.'s historical financial statements and pre-filled forecasts.
- Fully Adjustable Inputs: Customize WACC, tax rates, revenue growth, and EBITDA margins.
- Instant Results: Watch the intrinsic value of Shaanxi Beiyuan Chemical Industry Group Co., Ltd. (601568SS) update in real time.
- Clear Visual Outputs: Dashboard charts present valuation results and essential metrics clearly.
- Built for Accuracy: A professional-grade tool designed for analysts, investors, and finance professionals.
How It Works
- Step 1: Download the Excel file.
- Step 2: Review the pre-entered data for Shaanxi Beiyuan Chemical Industry Group Co., Ltd. (601568SS).
- Step 3: Modify key assumptions (yellow cells) according to your analysis.
- Step 4: Observe the automatic recalculations for the intrinsic value of Shaanxi Beiyuan Chemical Industry Group Co., Ltd. (601568SS).
- Step 5: Utilize the results for your investment decisions or reporting needs.
Why Opt for Shaanxi Beiyuan's Solutions?
- Time-Saving: Skip the hassle of building models from scratch – our tools are instantly ready for use.
- Enhanced Accuracy: Our dependable financial data and formulas minimize valuation errors.
- Completely Customizable: Adapt the models to suit your unique assumptions and forecasts.
- User-Friendly: Intuitive charts and outputs ensure results are straightforward to interpret.
- Preferred by Professionals: Crafted for industry experts who prioritize accuracy and ease of use.
Who Should Use This Product?
- Institutional Investors: Develop comprehensive and dependable valuation models for assessing investments in Shaanxi Beiyuan Chemical Industry Group Co., Ltd. (601568SS).
- Corporate Finance Departments: Evaluate valuation scenarios to inform strategic decisions within their firms.
- Financial Consultants and Advisors: Offer clients precise valuation analysis for Shaanxi Beiyuan Chemical Industry Group Co., Ltd. (601568SS).
- Academics and Students: Utilize real market data to enhance learning and practice in financial modeling.
- Chemical Industry Enthusiasts: Gain insight into how companies like Shaanxi Beiyuan Chemical Industry Group Co., Ltd. (601568SS) are valued within the industry.
What the Template Contains
- Pre-Filled DCF Model: Shaanxi Beiyuan Chemical’s financial data preloaded for immediate analysis.
- WACC Calculator: Comprehensive calculations for Weighted Average Cost of Capital.
- Financial Ratios: Assess Shaanxi Beiyuan Chemical’s profitability, leverage, and operational efficiency.
- Editable Inputs: Modify assumptions such as growth rates, margins, and CAPEX to suit your analysis.
- Financial Statements: Annual and quarterly reports to facilitate thorough evaluation.
- Interactive Dashboard: Effortlessly visualize key valuation metrics and outcomes.
Disclaimer
All information, articles, and product details provided on this website are for general informational and educational purposes only. We do not claim any ownership over, nor do we intend to infringe upon, any trademarks, copyrights, logos, brand names, or other intellectual property mentioned or depicted on this site. Such intellectual property remains the property of its respective owners, and any references here are made solely for identification or informational purposes, without implying any affiliation, endorsement, or partnership.
We make no representations or warranties, express or implied, regarding the accuracy, completeness, or suitability of any content or products presented. Nothing on this website should be construed as legal, tax, investment, financial, medical, or other professional advice. In addition, no part of this site—including articles or product references—constitutes a solicitation, recommendation, endorsement, advertisement, or offer to buy or sell any securities, franchises, or other financial instruments, particularly in jurisdictions where such activity would be unlawful.
All content is of a general nature and may not address the specific circumstances of any individual or entity. It is not a substitute for professional advice or services. Any actions you take based on the information provided here are strictly at your own risk. You accept full responsibility for any decisions or outcomes arising from your use of this website and agree to release us from any liability in connection with your use of, or reliance upon, the content or products found herein.