
|
شركة Xiangyang Changyuandonggu Industry Co. ، Ltd. (603950.SS) تقييم DCF |
Fully Editable: Tailor To Your Needs In Excel Or Sheets
Professional Design: Trusted, Industry-Standard Templates
Investor-Approved Valuation Models
MAC/PC Compatible, Fully Unlocked
No Expertise Is Needed; Easy To Follow
Xiangyang Changyuandonggu Industry Co., Ltd. (603950.SS) Bundle
تبسيط التحليل الخاص بك وزيادة الدقة مع حاسبة (603950ss) DCF! معبأة بالبيانات الحقيقية من شركة Xiangyang Changyuandonggu Industry Co. ، Ltd. وافتراضات قابلة للتخصيص ، تمكنك هذه الأداة من التنبؤ وتحليل وتقييم قيمة (603950ss) تمامًا مثل المستثمر المخضرم.
Discounted Cash Flow (DCF) - (USD MM)
| Year | AY1 2020 |
AY2 2021 |
AY3 2022 |
AY4 2023 |
AY5 2024 |
FY1 2025 |
FY2 2026 |
FY3 2027 |
FY4 2028 |
FY5 2029 |
|---|---|---|---|---|---|---|---|---|---|---|
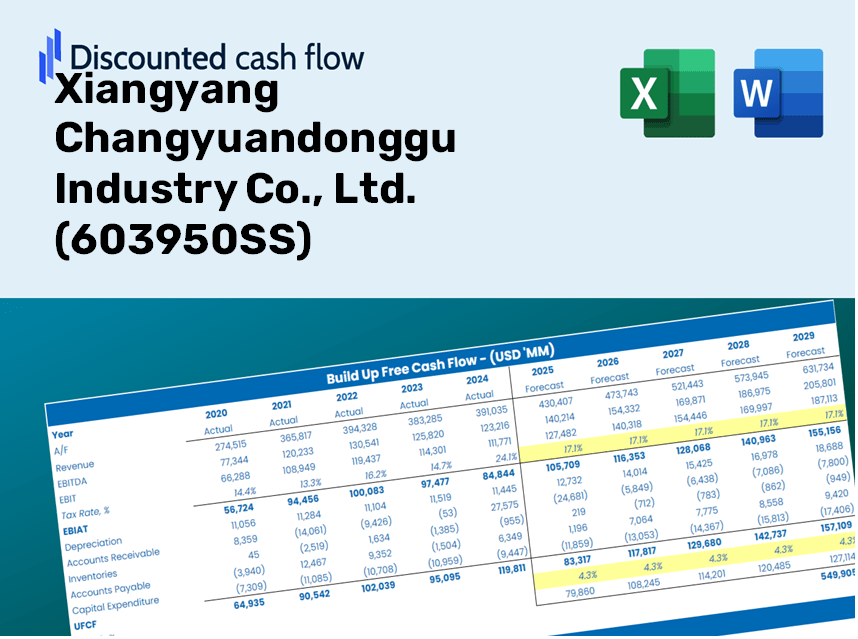
| Revenue | 1,678.0 | 1,581.5 | 1,116.0 | 1,472.3 | 1,919.7 | 2,049.9 | 2,188.9 | 2,337.3 | 2,495.9 | 2,665.1 |
| Revenue Growth, % | 0 | -5.75 | -29.43 | 31.92 | 30.38 | 6.78 | 6.78 | 6.78 | 6.78 | 6.78 |
| EBITDA | 493.0 | 444.9 | 277.6 | 397.8 | 485.1 | 552.1 | 589.6 | 629.6 | 672.3 | 717.9 |
| EBITDA, % | 29.38 | 28.13 | 24.87 | 27.02 | 25.27 | 26.94 | 26.94 | 26.94 | 26.94 | 26.94 |
| Depreciation | 151.1 | 189.6 | 204.3 | 205.1 | 249.9 | 271.6 | 290.0 | 309.7 | 330.7 | 353.1 |
| Depreciation, % | 9.01 | 11.99 | 18.3 | 13.93 | 13.02 | 13.25 | 13.25 | 13.25 | 13.25 | 13.25 |
| EBIT | 341.9 | 255.3 | 73.3 | 192.7 | 235.2 | 280.5 | 299.6 | 319.9 | 341.6 | 364.7 |
| EBIT, % | 20.38 | 16.14 | 6.57 | 13.08 | 12.25 | 13.69 | 13.69 | 13.69 | 13.69 | 13.69 |
| Total Cash | 646.7 | 665.6 | 618.5 | 327.5 | 340.1 | 721.6 | 770.5 | 822.8 | 878.6 | 938.2 |
| Total Cash, percent | .0 | .0 | .0 | .0 | .0 | .0 | .0 | .0 | .0 | .0 |
| Account Receivables | 843.6 | 667.4 | 753.4 | 800.9 | 1,193.3 | 1,133.7 | 1,210.6 | 1,292.7 | 1,380.4 | 1,474.0 |
| Account Receivables, % | 50.28 | 42.2 | 67.51 | 54.39 | 62.16 | 55.31 | 55.31 | 55.31 | 55.31 | 55.31 |
| Inventories | 233.5 | 308.1 | 340.3 | 425.9 | 527.0 | 493.1 | 526.5 | 562.2 | 600.4 | 641.1 |
| Inventories, % | 13.92 | 19.48 | 30.49 | 28.93 | 27.45 | 24.05 | 24.05 | 24.05 | 24.05 | 24.05 |
| Accounts Payable | 493.2 | 495.9 | 514.2 | 714.2 | 1,161.7 | 884.9 | 944.9 | 1,009.0 | 1,077.5 | 1,150.5 |
| Accounts Payable, % | 29.39 | 31.36 | 46.08 | 48.51 | 60.52 | 43.17 | 43.17 | 43.17 | 43.17 | 43.17 |
| Capital Expenditure | -379.0 | -374.8 | -256.5 | -670.9 | -402.2 | -556.7 | -594.4 | -634.8 | -677.8 | -723.8 |
| Capital Expenditure, % | -22.59 | -23.7 | -22.98 | -45.56 | -20.95 | -27.16 | -27.16 | -27.16 | -27.16 | -27.16 |
| Tax Rate, % | 14.35 | 14.35 | 14.35 | 14.35 | 14.35 | 14.35 | 14.35 | 14.35 | 14.35 | 14.35 |
| EBITAT | 292.7 | 227.1 | 67.2 | 171.3 | 201.5 | 247.3 | 264.1 | 282.0 | 301.1 | 321.6 |
| Depreciation | ||||||||||
| Changes in Account Receivables | ||||||||||
| Changes in Inventories | ||||||||||
| Changes in Accounts Payable | ||||||||||
| Capital Expenditure | ||||||||||
| UFCF | -519.1 | 146.2 | -85.0 | -227.5 | 3.2 | -221.1 | -90.6 | -96.8 | -103.4 | -110.4 |
| WACC, % | 6.17 | 6.17 | 6.18 | 6.17 | 6.17 | 6.17 | 6.17 | 6.17 | 6.17 | 6.17 |
| PV UFCF | ||||||||||
| SUM PV UFCF | -532.6 | |||||||||
| Long Term Growth Rate, % | 3.00 | |||||||||
| Free cash flow (T + 1) | -114 | |||||||||
| Terminal Value | -3,585 | |||||||||
| Present Terminal Value | -2,657 | |||||||||
| Enterprise Value | -3,190 | |||||||||
| Net Debt | 400 | |||||||||
| Equity Value | -3,590 | |||||||||
| Diluted Shares Outstanding, MM | 323 | |||||||||
| Equity Value Per Share | -11.11 |
ماذا ستتلقى
- البيانات المالية (603950ss): السجلات التاريخية الشاملة والتوقعات للتقييم الدقيق.
- المعلمات القابلة للتخصيص: اضبط WACC ومعدلات الضرائب ونمو الإيرادات وأرقام استثمار رأس المال حسب الحاجة.
- الحسابات التلقائية: الحسابات الديناميكية للقيمة الجوهرية و NPV.
- اختبار السيناريو: استكشف السيناريوهات المختلفة لتقييم الأداء المستقبلي لشركة Xiangyang Changyuandonggu Industry Co. ، Ltd.
- تصميم سهل الاستخدام ومهني: تم تصميمه للخبراء مع بقاء ودودين للوافدين الجدد.
الميزات الرئيسية
- مدخلات مالية قابلة للتخصيص: اضبط المعلمات الأساسية مثل نمو الإيرادات ، EBITDA ٪ ، والنفقات الرأسمالية لتناسب تحليلك.
- تقييم DCF الفوري: يحسب تلقائيًا القيمة الجوهرية ، NPV ، والمقاييس الإضافية في الوقت الفعلي.
- دقة عالية الدقة: يتضمن شركة Xiangyang Changyuandonggu Industry Co. ، Ltd. (603950ss) البيانات المالية الفعلية لنتائج التقييم الموثوقة.
- تحليل السيناريو السهل: استكشف افتراضات مختلفة ومقارنة السيناريوهات الناتجة بسهولة.
- داعم الكفاءة: تبسيط العملية عن طريق تجنب تعقيد بناء نماذج التقييم من الألف إلى الياء.
كيف تعمل
- الخطوة 1: قم بتنزيل ملف Excel لـ Xiangyang Changyuandonggu Industry Co. ، Ltd. (603950ss).
- الخطوة 2: فحص البيانات المليئة مسبقًا بـ Xiangyang Changyuandonggu ، بما في ذلك الشخصيات التاريخية والتنبؤ.
- الخطوة 3: تعديل الافتراضات الرئيسية (المبرمة باللون الأصفر) وفقا لتحليلك.
- الخطوة 4: راقب إعادة المعايرة التلقائية لقيمة Xiangyang Changyuandonggu الجوهرية.
- الخطوة 5: الاستفادة من نتائج قرارات الاستثمار الخاصة بك أو احتياجات الإبلاغ.
لماذا تختار هذه الآلة الحاسبة؟
- دقة: يستخدم شركة Xiangyang Changyuandonggu Industry الأصلية ، Ltd. المالية لضمان موثوقية البيانات.
- التنوع: تم تصميمه للسماح للمستخدمين بتجربة المدخلات وضبطها وفقًا لتقديرهم.
- كفاءة: التخلص من الحاجة إلى إنشاء نموذج DCF من الألف إلى الياء.
- مستوى الخبراء: هندسة مع الدقة والوظائف التي يفضلها المدير المالي.
- يمكن الوصول إليه: التصميم البديهي يجعل الأمر بسيطًا للمستخدمين ، بغض النظر عن خلفية النمذجة المالية.
من يمكنه الاستفادة من خدماتنا؟
- طلاب التصنيع: استكشاف التقنيات الخاصة بالصناعة وتطبيقها مع بيانات العالم الحقيقي.
- الباحثون: الاستفادة من النماذج المهنية لتعزيز مشاريعك الأكاديمية والدراسات.
- المستثمرون: التحقق من صحة فرضيات الاستثمار الخاصة بك وتقييم مقاييس التقييم لشركة Xiangyang Changyuandonggu Industry Co. ، Ltd. (603950ss).
- محللي السوق: قم بتحسين عملية التحليل الخاصة بك من خلال نماذج مالية جاهزة للاستخدام وقابلة للتخصيص.
- رواد الأعمال: اكتشف كيف يتم تقييم شركات التصنيع الرئيسية مثل Xiangyang Changyuandonggu Industry Co. ، Ltd. (603950ss) في السوق.
محتويات القالب
- نموذج DCF الشامل: قالب قابل للتحرير يضم حسابات التقييم المتعمقة.
- بيانات العالم الحقيقي: Xiangyang Changyuandonggu Industry Co. ، Ltd. (603950ss) ، تم تحميل البيانات المالية التاريخية والمتوقعة للتحليل الفوري.
- المعلمات القابلة للتخصيص: تعديل WACC ومعدلات النمو والافتراضات الضريبية لاستكشاف السيناريوهات المختلفة.
- البيانات المالية: انهيار سنوي وفصلي مفصل للتفاصيل المحسنة.
- النسب الرئيسية: تحليل متكامل يغطي الربحية والكفاءة والرافعة المالية.
- لوحة القيادة مع المخرجات المرئية: إشراك المخططات والجداول التي تقدم نتائج واضحة وقابلة للتنفيذ.
Disclaimer
All information, articles, and product details provided on this website are for general informational and educational purposes only. We do not claim any ownership over, nor do we intend to infringe upon, any trademarks, copyrights, logos, brand names, or other intellectual property mentioned or depicted on this site. Such intellectual property remains the property of its respective owners, and any references here are made solely for identification or informational purposes, without implying any affiliation, endorsement, or partnership.
We make no representations or warranties, express or implied, regarding the accuracy, completeness, or suitability of any content or products presented. Nothing on this website should be construed as legal, tax, investment, financial, medical, or other professional advice. In addition, no part of this site—including articles or product references—constitutes a solicitation, recommendation, endorsement, advertisement, or offer to buy or sell any securities, franchises, or other financial instruments, particularly in jurisdictions where such activity would be unlawful.
All content is of a general nature and may not address the specific circumstances of any individual or entity. It is not a substitute for professional advice or services. Any actions you take based on the information provided here are strictly at your own risk. You accept full responsibility for any decisions or outcomes arising from your use of this website and agree to release us from any liability in connection with your use of, or reliance upon, the content or products found herein.