
|
Xiangyang Changyuandonggu Industry Co., Ltd. (603950.SS) DCF Valuation |
Fully Editable: Tailor To Your Needs In Excel Or Sheets
Professional Design: Trusted, Industry-Standard Templates
Investor-Approved Valuation Models
MAC/PC Compatible, Fully Unlocked
No Expertise Is Needed; Easy To Follow
Xiangyang Changyuandonggu Industry Co., Ltd. (603950.SS) Bundle
Streamline your analysis and boost precision with our (603950SS) DCF Calculator! Packed with real data from Xiangyang Changyuandonggu Industry Co., Ltd. and customizable assumptions, this tool enables you to forecast, analyze, and assess the value of (603950SS) just like a seasoned investor.
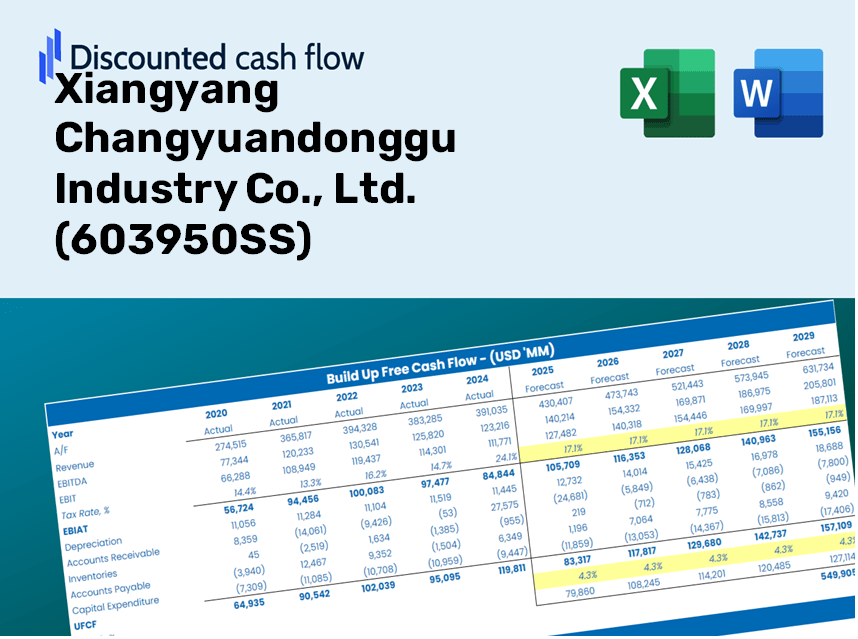
Discounted Cash Flow (DCF) - (USD MM)
| Year | AY1 2020 |
AY2 2021 |
AY3 2022 |
AY4 2023 |
AY5 2024 |
FY1 2025 |
FY2 2026 |
FY3 2027 |
FY4 2028 |
FY5 2029 |
|---|---|---|---|---|---|---|---|---|---|---|
| Revenue | 1,678.0 | 1,581.5 | 1,116.0 | 1,472.3 | 1,919.7 | 2,049.9 | 2,188.9 | 2,337.3 | 2,495.9 | 2,665.1 |
| Revenue Growth, % | 0 | -5.75 | -29.43 | 31.92 | 30.38 | 6.78 | 6.78 | 6.78 | 6.78 | 6.78 |
| EBITDA | 493.0 | 444.9 | 277.6 | 397.8 | 485.1 | 552.1 | 589.6 | 629.6 | 672.3 | 717.9 |
| EBITDA, % | 29.38 | 28.13 | 24.87 | 27.02 | 25.27 | 26.94 | 26.94 | 26.94 | 26.94 | 26.94 |
| Depreciation | 151.1 | 189.6 | 204.3 | 205.1 | 249.9 | 271.6 | 290.0 | 309.7 | 330.7 | 353.1 |
| Depreciation, % | 9.01 | 11.99 | 18.3 | 13.93 | 13.02 | 13.25 | 13.25 | 13.25 | 13.25 | 13.25 |
| EBIT | 341.9 | 255.3 | 73.3 | 192.7 | 235.2 | 280.5 | 299.6 | 319.9 | 341.6 | 364.7 |
| EBIT, % | 20.38 | 16.14 | 6.57 | 13.08 | 12.25 | 13.69 | 13.69 | 13.69 | 13.69 | 13.69 |
| Total Cash | 646.7 | 665.6 | 618.5 | 327.5 | 340.1 | 721.6 | 770.5 | 822.8 | 878.6 | 938.2 |
| Total Cash, percent | .0 | .0 | .0 | .0 | .0 | .0 | .0 | .0 | .0 | .0 |
| Account Receivables | 843.6 | 667.4 | 753.4 | 800.9 | 1,193.3 | 1,133.7 | 1,210.6 | 1,292.7 | 1,380.4 | 1,474.0 |
| Account Receivables, % | 50.28 | 42.2 | 67.51 | 54.39 | 62.16 | 55.31 | 55.31 | 55.31 | 55.31 | 55.31 |
| Inventories | 233.5 | 308.1 | 340.3 | 425.9 | 527.0 | 493.1 | 526.5 | 562.2 | 600.4 | 641.1 |
| Inventories, % | 13.92 | 19.48 | 30.49 | 28.93 | 27.45 | 24.05 | 24.05 | 24.05 | 24.05 | 24.05 |
| Accounts Payable | 493.2 | 495.9 | 514.2 | 714.2 | 1,161.7 | 884.9 | 944.9 | 1,009.0 | 1,077.5 | 1,150.5 |
| Accounts Payable, % | 29.39 | 31.36 | 46.08 | 48.51 | 60.52 | 43.17 | 43.17 | 43.17 | 43.17 | 43.17 |
| Capital Expenditure | -379.0 | -374.8 | -256.5 | -670.9 | -402.2 | -556.7 | -594.4 | -634.8 | -677.8 | -723.8 |
| Capital Expenditure, % | -22.59 | -23.7 | -22.98 | -45.56 | -20.95 | -27.16 | -27.16 | -27.16 | -27.16 | -27.16 |
| Tax Rate, % | 14.35 | 14.35 | 14.35 | 14.35 | 14.35 | 14.35 | 14.35 | 14.35 | 14.35 | 14.35 |
| EBITAT | 292.7 | 227.1 | 67.2 | 171.3 | 201.5 | 247.3 | 264.1 | 282.0 | 301.1 | 321.6 |
| Depreciation | ||||||||||
| Changes in Account Receivables | ||||||||||
| Changes in Inventories | ||||||||||
| Changes in Accounts Payable | ||||||||||
| Capital Expenditure | ||||||||||
| UFCF | -519.1 | 146.2 | -85.0 | -227.5 | 3.2 | -221.1 | -90.6 | -96.8 | -103.4 | -110.4 |
| WACC, % | 6.17 | 6.17 | 6.18 | 6.17 | 6.17 | 6.17 | 6.17 | 6.17 | 6.17 | 6.17 |
| PV UFCF | ||||||||||
| SUM PV UFCF | -532.6 | |||||||||
| Long Term Growth Rate, % | 3.00 | |||||||||
| Free cash flow (T + 1) | -114 | |||||||||
| Terminal Value | -3,585 | |||||||||
| Present Terminal Value | -2,657 | |||||||||
| Enterprise Value | -3,190 | |||||||||
| Net Debt | 400 | |||||||||
| Equity Value | -3,590 | |||||||||
| Diluted Shares Outstanding, MM | 323 | |||||||||
| Equity Value Per Share | -11.11 |
What You Will Receive
- Authentic (603950SS) Financial Data: Comprehensive historical records and projections for precise valuation.
- Customizable Parameters: Adjust WACC, tax rates, revenue growth, and capital investment figures as needed.
- Automatic Computations: Dynamic calculations for intrinsic value and NPV.
- Scenario Testing: Explore various scenarios to assess the future performance of Xiangyang Changyuandonggu Industry Co., Ltd.
- User-Friendly and Professional Design: Crafted for experts while remaining approachable for newcomers.
Key Features
- Customizable Financial Inputs: Adjust essential parameters such as revenue growth, EBITDA %, and capital expenditures to fit your analysis.
- Instant DCF Valuation: Automatically calculates the intrinsic value, NPV, and additional metrics in real-time.
- High-Precision Accuracy: Incorporates Xiangyang Changyuandonggu Industry Co., Ltd.'s (603950SS) actual financial data for credible valuation results.
- Effortless Scenario Analysis: Explore various assumptions and easily compare the resulting scenarios.
- Efficiency Booster: Streamline your process by avoiding the complexity of constructing valuation models from the ground up.
How It Works
- Step 1: Download the Excel file for Xiangyang Changyuandonggu Industry Co., Ltd. (603950SS).
- Step 2: Examine the pre-filled data for Xiangyang Changyuandonggu, including historical and forecast figures.
- Step 3: Modify key assumptions (highlighted in yellow) according to your analysis.
- Step 4: Observe the automatic recalibration of Xiangyang Changyuandonggu's intrinsic value.
- Step 5: Utilize the results for your investment decisions or reporting needs.
Why Opt for This Calculator?
- Precision: Utilizes authentic Xiangyang Changyuandonggu Industry Co., Ltd. financials to ensure data reliability.
- Versatility: Crafted to allow users to experiment with and adjust inputs at their discretion.
- Efficiency: Eliminate the need to create a DCF model from the ground up.
- Expert-Level: Engineered with the accuracy and functionality preferred by CFOs.
- Accessible: Intuitive design makes it simple for users, regardless of their financial modeling background.
Who Can Benefit from Our Services?
- Manufacturing Students: Explore industry-specific techniques and apply them with real-world data.
- Researchers: Utilize professional models to enhance your academic projects and studies.
- Investors: Validate your investment hypotheses and evaluate valuation metrics for Xiangyang Changyuandonggu Industry Co., Ltd. (603950SS).
- Market Analysts: Optimize your analysis process with our ready-to-use, customizable financial models.
- Entrepreneurs: Discover how major manufacturing firms like Xiangyang Changyuandonggu Industry Co., Ltd. (603950SS) are evaluated in the market.
Contents of the Template
- Comprehensive DCF Model: Editable template featuring in-depth valuation calculations.
- Real-World Data: Xiangyang Changyuandonggu Industry Co., Ltd. (603950SS)’s historical and projected financials preloaded for immediate analysis.
- Customizable Parameters: Modify WACC, growth rates, and tax assumptions to explore various scenarios.
- Financial Statements: Detailed annual and quarterly breakdowns for enhanced insights.
- Key Ratios: Integrated analysis covering profitability, efficiency, and leverage metrics.
- Dashboard with Visual Outputs: Engaging charts and tables presenting clear, actionable results.
Disclaimer
All information, articles, and product details provided on this website are for general informational and educational purposes only. We do not claim any ownership over, nor do we intend to infringe upon, any trademarks, copyrights, logos, brand names, or other intellectual property mentioned or depicted on this site. Such intellectual property remains the property of its respective owners, and any references here are made solely for identification or informational purposes, without implying any affiliation, endorsement, or partnership.
We make no representations or warranties, express or implied, regarding the accuracy, completeness, or suitability of any content or products presented. Nothing on this website should be construed as legal, tax, investment, financial, medical, or other professional advice. In addition, no part of this site—including articles or product references—constitutes a solicitation, recommendation, endorsement, advertisement, or offer to buy or sell any securities, franchises, or other financial instruments, particularly in jurisdictions where such activity would be unlawful.
All content is of a general nature and may not address the specific circumstances of any individual or entity. It is not a substitute for professional advice or services. Any actions you take based on the information provided here are strictly at your own risk. You accept full responsibility for any decisions or outcomes arising from your use of this website and agree to release us from any liability in connection with your use of, or reliance upon, the content or products found herein.