
|
شركة Yunnan Shennong Agricultural Industry Group ، Ltd. (605296.SS) تقييم DCF |
Fully Editable: Tailor To Your Needs In Excel Or Sheets
Professional Design: Trusted, Industry-Standard Templates
Investor-Approved Valuation Models
MAC/PC Compatible, Fully Unlocked
No Expertise Is Needed; Easy To Follow
Yunnan Shennong Agricultural Industry Group Co.,LTD. (605296.SS) Bundle
قم بتبسيط تحليلك المالي وتحسين الدقة باستخدام حاسبة DCF (605296SS)! استخدام بيانات حقيقية من Yunnan Shennong Agricultural Industry Group Co.، LTD. والافتراضات القابلة للتخصيص، تمكنك هذه الأداة من التنبؤ والتحليل والقيمة (605296SS) كما يفعل المستثمر المخضرم.
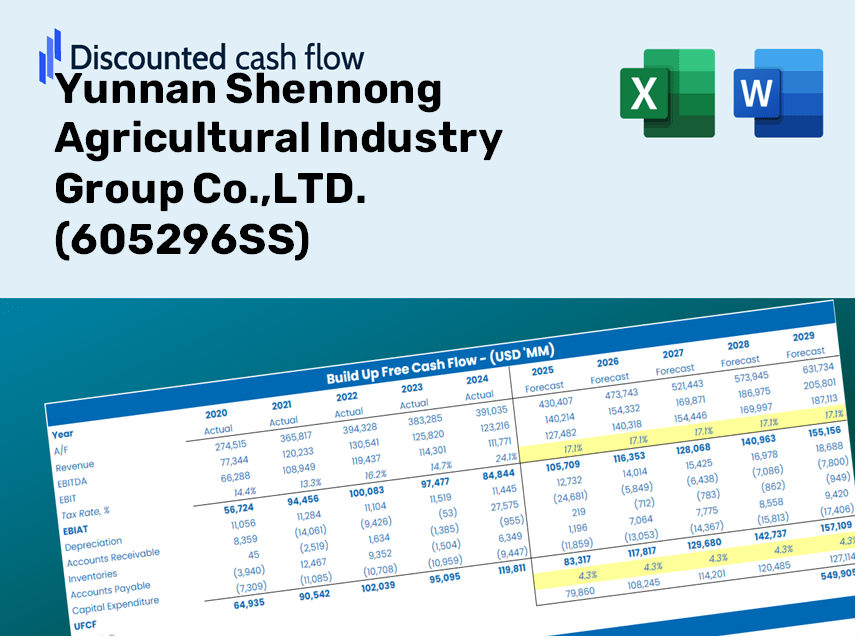
Discounted Cash Flow (DCF) - (USD MM)
| Year | AY1 2020 |
AY2 2021 |
AY3 2022 |
AY4 2023 |
AY5 2024 |
FY1 2025 |
FY2 2026 |
FY3 2027 |
FY4 2028 |
FY5 2029 |
|---|---|---|---|---|---|---|---|---|---|---|
| Revenue | 2,724.5 | 2,779.5 | 3,304.5 | 3,891.3 | 5,584.3 | 6,731.6 | 8,114.5 | 9,781.5 | 11,790.9 | 14,213.2 |
| Revenue Growth, % | 0 | 2.02 | 18.89 | 17.76 | 43.51 | 20.54 | 20.54 | 20.54 | 20.54 | 20.54 |
| EBITDA | 1,254.8 | 448.2 | 473.2 | -88.5 | 1,114.0 | 1,267.9 | 1,528.4 | 1,842.3 | 2,220.8 | 2,677.1 |
| EBITDA, % | 46.06 | 16.12 | 14.32 | -2.27 | 19.95 | 18.84 | 18.84 | 18.84 | 18.84 | 18.84 |
| Depreciation | 105.7 | 180.2 | 217.4 | 308.8 | 372.7 | 424.8 | 512.0 | 617.2 | 744.0 | 896.9 |
| Depreciation, % | 3.88 | 6.48 | 6.58 | 7.93 | 6.67 | 6.31 | 6.31 | 6.31 | 6.31 | 6.31 |
| EBIT | 1,149.1 | 268.0 | 255.8 | -397.3 | 741.3 | 843.1 | 1,016.3 | 1,225.1 | 1,476.8 | 1,780.2 |
| EBIT, % | 42.18 | 9.64 | 7.74 | -10.21 | 13.27 | 12.52 | 12.52 | 12.52 | 12.52 | 12.52 |
| Total Cash | 558.4 | 1,731.5 | 1,135.8 | 545.2 | 1,042.2 | 2,017.3 | 2,431.8 | 2,931.3 | 3,533.5 | 4,259.4 |
| Total Cash, percent | .0 | .0 | .0 | .0 | .0 | .0 | .0 | .0 | .0 | .0 |
| Account Receivables | 23.3 | 101.0 | 101.6 | 126.7 | 129.0 | 176.7 | 213.0 | 256.8 | 309.5 | 373.1 |
| Account Receivables, % | 0.85389 | 3.63 | 3.07 | 3.26 | 2.31 | 2.63 | 2.63 | 2.63 | 2.63 | 2.63 |
| Inventories | 558.9 | 812.7 | 1,082.1 | 1,285.9 | 1,310.1 | 1,871.5 | 2,255.9 | 2,719.4 | 3,278.1 | 3,951.5 |
| Inventories, % | 20.52 | 29.24 | 32.75 | 33.05 | 23.46 | 27.8 | 27.8 | 27.8 | 27.8 | 27.8 |
| Accounts Payable | 274.7 | 338.9 | 375.1 | 491.3 | 608.7 | 769.4 | 927.5 | 1,118.0 | 1,347.7 | 1,624.6 |
| Accounts Payable, % | 10.08 | 12.19 | 11.35 | 12.63 | 10.9 | 11.43 | 11.43 | 11.43 | 11.43 | 11.43 |
| Capital Expenditure | -628.9 | -1,184.2 | -801.1 | -999.2 | -980.8 | -1,792.9 | -2,161.2 | -2,605.2 | -3,140.4 | -3,785.6 |
| Capital Expenditure, % | -23.08 | -42.61 | -24.24 | -25.68 | -17.56 | -26.63 | -26.63 | -26.63 | -26.63 | -26.63 |
| Tax Rate, % | 2.66 | 2.66 | 2.66 | 2.66 | 2.66 | 2.66 | 2.66 | 2.66 | 2.66 | 2.66 |
| EBITAT | 1,143.7 | 252.5 | 259.4 | -395.6 | 721.5 | 827.3 | 997.3 | 1,202.2 | 1,449.1 | 1,746.9 |
| Depreciation | ||||||||||
| Changes in Account Receivables | ||||||||||
| Changes in Inventories | ||||||||||
| Changes in Accounts Payable | ||||||||||
| Capital Expenditure | ||||||||||
| UFCF | 313.0 | -1,018.9 | -558.1 | -1,198.6 | 204.3 | -989.1 | -914.6 | -1,102.5 | -1,329.0 | -1,602.0 |
| WACC, % | 7.82 | 7.8 | 7.82 | 7.82 | 7.81 | 7.81 | 7.81 | 7.81 | 7.81 | 7.81 |
| PV UFCF | ||||||||||
| SUM PV UFCF | -4,667.4 | |||||||||
| Long Term Growth Rate, % | 3.00 | |||||||||
| Free cash flow (T + 1) | -1,650 | |||||||||
| Terminal Value | -34,281 | |||||||||
| Present Terminal Value | -23,534 | |||||||||
| Enterprise Value | -28,201 | |||||||||
| Net Debt | -480 | |||||||||
| Equity Value | -27,721 | |||||||||
| Diluted Shares Outstanding, MM | 524 | |||||||||
| Equity Value Per Share | -52.87 |
الفوائد التي ستتلقاها
- يونان شينونج المالية الأصلية: بيانات تاريخية ومتوقعة شاملة للتقييم الدقيق.
- مدخلات قابلة للتخصيص: اضبط المقاييس الرئيسية مثل WACC ومعدلات الضرائب ونمو الإيرادات والاستثمارات الرأسمالية.
- الحسابات في الوقت الحقيقي: يقوم بحساب القيمة الجوهرية تلقائيًا و NPV عند تحديث البيانات.
- تخطيط السيناريو: استكشف السيناريوهات المختلفة لتقييم الأداء المستقبلي لشركة Yunnan Shennong Agricultural Industry Group ، Ltd. (605296SS).
- تصميم سهل الاستخدام: تم تصميمه للمهنيين في هذا المجال مع بقاء ودودين للقادمين الجدد.
الميزات الرئيسية
- في الوقت الحقيقي بيانات يونان شينونج: تم تحميلها مسبقًا مع البيانات المالية التاريخية والتوقعات المستقبلية لشركة Yunnan Shennong Agricultural Industry Group ، Ltd. (605296SS).
- متغيرات قابلة للتخصيص تمامًا: تعديل المدخلات مثل نمو الإيرادات ، هوامش الربح ، WACC ، معدلات الضرائب ، والنفقات الرأسمالية.
- نموذج التقييم التفاعلي: عمليات إعادة حساب تلقائية للقيمة الحالية الصافية (NPV) والقيمة الجوهرية بناءً على المعلمات المعرفة من قبل المستخدم.
- تحليل السيناريو: تطوير سيناريوهات التنبؤ المختلفة لتقييم نتائج التقييم المختلفة.
- الواجهة المتمحورة حول المستخدم: التصميم البديهي الذي يلبي كل من محترفي الصناعة والوافدين الجدد.
كيف تعمل
- الخطوة 1: قم بتنزيل ملف Excel.
- الخطوة 2: فحص شركة Yunnan Shennong Invancultural Industry Group ، Ltd.
- الخطوة 3: ضبط المدخلات الرئيسية مثل نمو الإيرادات ، WACC ، ومعدلات الضرائب (الخلايا المميزة).
- الخطوة 4: راقب تحديث نموذج DCF في الوقت الفعلي أثناء تعديل الافتراضات.
- الخطوة 5: راجع المخرجات واستخدم النتائج الخاصة باستراتيجيتك الاستثمارية.
لماذا تختار شركة Yunnan Shennong Agricultural Industry Group ، Ltd. (605296SS)؟
- دقة: يضمن الوصول إلى البيانات المالية الأصلية نتائج موثوقة.
- القدرة على التكيف: مصمم للمستخدمين لتجربة المتغيرات وضبطها دون عناء.
- كفاءة: القضاء على تعقيدات إنشاء نموذج مالي من الألف إلى الياء.
- مستوى الخبراء: مصنوعة من الدقة والوظائف المتوقعة من كبار المهنيين الماليين.
- حدسي: بسيط للتنقل ، مما يجعله في متناول أولئك الجدد إلى التحليل المالي.
من سيستفيد من هذا المنتج؟
- المستثمرون الأفراد: كسب رؤى لاتخاذ قرارات متعلمة بشأن شراء أو بيع أسهم شركة Yunnan Shennong Industry Group Co. ، Ltd. (605296SS).
- المحللون الماليون: تعزيز عمليات التقييم مع نماذج مالية سهلة التنفيذ مصممة خصيصًا لـ Yunnan Shennong.
- الاستشاريون: تزويد العملاء برؤى تقييم دقيقة وفي الوقت المناسب تتعلق بـ Yunnan Shennong Industry Group Co. ، Ltd.
- أصحاب الأعمال: تعلم من استراتيجيات تقييم الشركات الكبيرة مثل Yunnan Shennong لإبلاغ نهج عملك الخاص.
- طلاب التمويل: استكشاف منهجيات التقييم باستخدام بيانات في الوقت الفعلي ودراسات الحالة من شركة Yunnan Shennong الزراعية ، المحدودة. (605296SS).
العناصر المدرجة في القالب
- بيانات التشغيل والميزانية العمومية: البيانات التاريخية المملوءة مسبقًا وتوقعات لشركة Yunnan Shennong Agricultural Industry Group ، Ltd. (605296SS) ، التي تغطي الإيرادات ، EBITDA ، EBIT ، والنفقات الرأسمالية.
- حساب WACC: ورقة متخصصة لحساب متوسط تكلفة رأس المال المرجح (WACC) ، والتي تتميز معلمات مثل بيتا ، ومعدل خالي من المخاطر ، وسعر السهم.
- تقييم DCF (غير مقلوب ومحدود): نماذج التدفق النقدي المخفضة القابلة للتخصيص التي توفر قيمة جوهرية مع حسابات شاملة.
- البيانات المالية: البيانات المالية السنوية والفصلية التي تم تحميلها مسبقًا للمساعدة في تحليلك.
- النسب الرئيسية: يشمل الربحية الأساسية ، والرافعة المالية ، ونسب الكفاءة الخاصة بـ Yunnan Shennong Industry Industry Group Co. ، Ltd. (605296SS).
- لوحة القيادة والمخططات: ملخص مرئي لمخرجات التقييم والافتراضات لتحليل النتائج السهل.
Disclaimer
All information, articles, and product details provided on this website are for general informational and educational purposes only. We do not claim any ownership over, nor do we intend to infringe upon, any trademarks, copyrights, logos, brand names, or other intellectual property mentioned or depicted on this site. Such intellectual property remains the property of its respective owners, and any references here are made solely for identification or informational purposes, without implying any affiliation, endorsement, or partnership.
We make no representations or warranties, express or implied, regarding the accuracy, completeness, or suitability of any content or products presented. Nothing on this website should be construed as legal, tax, investment, financial, medical, or other professional advice. In addition, no part of this site—including articles or product references—constitutes a solicitation, recommendation, endorsement, advertisement, or offer to buy or sell any securities, franchises, or other financial instruments, particularly in jurisdictions where such activity would be unlawful.
All content is of a general nature and may not address the specific circumstances of any individual or entity. It is not a substitute for professional advice or services. Any actions you take based on the information provided here are strictly at your own risk. You accept full responsibility for any decisions or outcomes arising from your use of this website and agree to release us from any liability in connection with your use of, or reliance upon, the content or products found herein.