
|
Yunnan Shennong Agricultural Industry Group Co., Ltd. (605296.SS) DCF -Bewertung |
Fully Editable: Tailor To Your Needs In Excel Or Sheets
Professional Design: Trusted, Industry-Standard Templates
Investor-Approved Valuation Models
MAC/PC Compatible, Fully Unlocked
No Expertise Is Needed; Easy To Follow
Yunnan Shennong Agricultural Industry Group Co.,LTD. (605296.SS) Bundle
Optimieren Sie Ihre Finanzanalyse und verbessern Sie die Präzision mit unserem (605296S) DCF -Taschenrechner! Verwendung realer Daten der Yunnan Shennong Agricultural Industry Group Co., Ltd. und anpassbare Annahmen ermöglichen Sie dieses Tool, Sie als erfahrener Investor zu prognostizieren, zu analysieren und zu bewerten (605296Ss).
Discounted Cash Flow (DCF) - (USD MM)
| Year | AY1 2020 |
AY2 2021 |
AY3 2022 |
AY4 2023 |
AY5 2024 |
FY1 2025 |
FY2 2026 |
FY3 2027 |
FY4 2028 |
FY5 2029 |
|---|---|---|---|---|---|---|---|---|---|---|
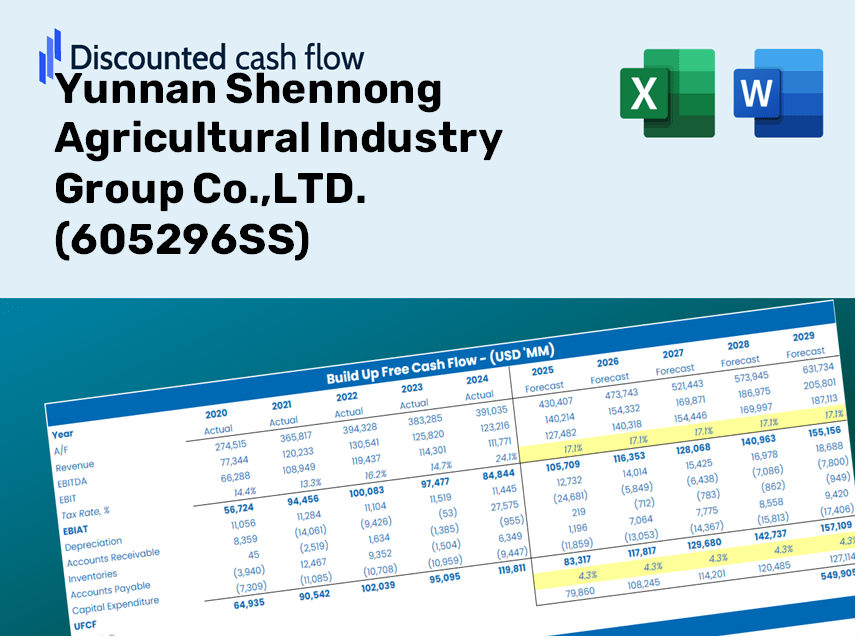
| Revenue | 2,724.5 | 2,779.5 | 3,304.5 | 3,891.3 | 5,584.3 | 6,731.6 | 8,114.5 | 9,781.5 | 11,790.9 | 14,213.2 |
| Revenue Growth, % | 0 | 2.02 | 18.89 | 17.76 | 43.51 | 20.54 | 20.54 | 20.54 | 20.54 | 20.54 |
| EBITDA | 1,254.8 | 448.2 | 473.2 | -88.5 | 1,114.0 | 1,267.9 | 1,528.4 | 1,842.3 | 2,220.8 | 2,677.1 |
| EBITDA, % | 46.06 | 16.12 | 14.32 | -2.27 | 19.95 | 18.84 | 18.84 | 18.84 | 18.84 | 18.84 |
| Depreciation | 105.7 | 180.2 | 217.4 | 308.8 | 372.7 | 424.8 | 512.0 | 617.2 | 744.0 | 896.9 |
| Depreciation, % | 3.88 | 6.48 | 6.58 | 7.93 | 6.67 | 6.31 | 6.31 | 6.31 | 6.31 | 6.31 |
| EBIT | 1,149.1 | 268.0 | 255.8 | -397.3 | 741.3 | 843.1 | 1,016.3 | 1,225.1 | 1,476.8 | 1,780.2 |
| EBIT, % | 42.18 | 9.64 | 7.74 | -10.21 | 13.27 | 12.52 | 12.52 | 12.52 | 12.52 | 12.52 |
| Total Cash | 558.4 | 1,731.5 | 1,135.8 | 545.2 | 1,042.2 | 2,017.3 | 2,431.8 | 2,931.3 | 3,533.5 | 4,259.4 |
| Total Cash, percent | .0 | .0 | .0 | .0 | .0 | .0 | .0 | .0 | .0 | .0 |
| Account Receivables | 23.3 | 101.0 | 101.6 | 126.7 | 129.0 | 176.7 | 213.0 | 256.8 | 309.5 | 373.1 |
| Account Receivables, % | 0.85389 | 3.63 | 3.07 | 3.26 | 2.31 | 2.63 | 2.63 | 2.63 | 2.63 | 2.63 |
| Inventories | 558.9 | 812.7 | 1,082.1 | 1,285.9 | 1,310.1 | 1,871.5 | 2,255.9 | 2,719.4 | 3,278.1 | 3,951.5 |
| Inventories, % | 20.52 | 29.24 | 32.75 | 33.05 | 23.46 | 27.8 | 27.8 | 27.8 | 27.8 | 27.8 |
| Accounts Payable | 274.7 | 338.9 | 375.1 | 491.3 | 608.7 | 769.4 | 927.5 | 1,118.0 | 1,347.7 | 1,624.6 |
| Accounts Payable, % | 10.08 | 12.19 | 11.35 | 12.63 | 10.9 | 11.43 | 11.43 | 11.43 | 11.43 | 11.43 |
| Capital Expenditure | -628.9 | -1,184.2 | -801.1 | -999.2 | -980.8 | -1,792.9 | -2,161.2 | -2,605.2 | -3,140.4 | -3,785.6 |
| Capital Expenditure, % | -23.08 | -42.61 | -24.24 | -25.68 | -17.56 | -26.63 | -26.63 | -26.63 | -26.63 | -26.63 |
| Tax Rate, % | 2.66 | 2.66 | 2.66 | 2.66 | 2.66 | 2.66 | 2.66 | 2.66 | 2.66 | 2.66 |
| EBITAT | 1,143.7 | 252.5 | 259.4 | -395.6 | 721.5 | 827.3 | 997.3 | 1,202.2 | 1,449.1 | 1,746.9 |
| Depreciation | ||||||||||
| Changes in Account Receivables | ||||||||||
| Changes in Inventories | ||||||||||
| Changes in Accounts Payable | ||||||||||
| Capital Expenditure | ||||||||||
| UFCF | 313.0 | -1,018.9 | -558.1 | -1,198.6 | 204.3 | -989.1 | -914.6 | -1,102.5 | -1,329.0 | -1,602.0 |
| WACC, % | 7.82 | 7.8 | 7.82 | 7.82 | 7.81 | 7.81 | 7.81 | 7.81 | 7.81 | 7.81 |
| PV UFCF | ||||||||||
| SUM PV UFCF | -4,667.4 | |||||||||
| Long Term Growth Rate, % | 3.00 | |||||||||
| Free cash flow (T + 1) | -1,650 | |||||||||
| Terminal Value | -34,281 | |||||||||
| Present Terminal Value | -23,534 | |||||||||
| Enterprise Value | -28,201 | |||||||||
| Net Debt | -480 | |||||||||
| Equity Value | -27,721 | |||||||||
| Diluted Shares Outstanding, MM | 524 | |||||||||
| Equity Value Per Share | -52.87 |
Benefits You Will Receive
- Authentic Yunnan Shennong Financials: Comprehensive historical and projected data for precise valuation.
- Customizable Inputs: Adjust key metrics such as WACC, tax rates, revenue growth, and capital investments.
- Real-Time Calculations: Automatically calculates intrinsic value and NPV as data is updated.
- Scenario Planning: Explore various scenarios to assess the future performance of Yunnan Shennong Agricultural Industry Group Co., LTD. (605296SS).
- User-Friendly Design: Crafted for industry professionals while remaining approachable for newcomers.
Key Features
- Real-Time Yunnan Shennong Data: Pre-loaded with the historical financial data and future projections for Yunnan Shennong Agricultural Industry Group Co.,LTD. (605296SS).
- Completely Customizable Variables: Modify inputs like revenue growth, profit margins, WACC, tax rates, and capital expenditures.
- Interactive Valuation Model: Automatic recalculations of Net Present Value (NPV) and intrinsic value based on user-defined parameters.
- Scenario Analysis: Develop various forecasting scenarios to assess different valuation results.
- User-Centric Interface: Intuitive design that caters to both industry professionals and newcomers.
How It Functions
- Step 1: Download the Excel file.
- Step 2: Examine Yunnan Shennong Agricultural Industry Group Co., LTD.'s pre-filled financial data and projections.
- Step 3: Adjust key inputs such as revenue growth, WACC, and tax rates (highlighted cells).
- Step 4: Observe the DCF model update in real-time as you modify the assumptions.
- Step 5: Review the outputs and utilize the findings for your investment strategy.
Why Opt for Yunnan Shennong Agricultural Industry Group Co., LTD. (605296SS)?
- Precision: Access to authentic financial data guarantees reliable results.
- Adaptability: Tailored for users to experiment with and adjust variables effortlessly.
- Efficiency: Eliminate the complexities of creating a financial model from the ground up.
- Expert-Level: Crafted with the accuracy and functionality expected from top financial professionals.
- Intuitive: Simple to navigate, making it accessible for those new to financial analysis.
Who Would Benefit from This Product?
- Individual Investors: Gain insights to make educated decisions on purchasing or selling shares of Yunnan Shennong Agricultural Industry Group Co.,LTD. (605296SS).
- Financial Analysts: Enhance valuation processes with easy-to-implement financial models tailored for Yunnan Shennong.
- Consultants: Provide clients with accurate and timely valuation insights related to Yunnan Shennong Agricultural Industry Group Co.,LTD.
- Business Owners: Learn from the valuation strategies of large enterprises like Yunnan Shennong to inform your own business approach.
- Finance Students: Explore valuation methodologies using real-time data and case studies from Yunnan Shennong Agricultural Industry Group Co.,LTD. (605296SS).
Items Included in the Template
- Operating and Balance Sheet Data: Pre-filled historical data and forecasts for Yunnan Shennong Agricultural Industry Group Co.,LTD. (605296SS), covering revenue, EBITDA, EBIT, and capital expenditures.
- WACC Calculation: A specialized sheet for calculating the Weighted Average Cost of Capital (WACC), featuring parameters such as Beta, risk-free rate, and share price.
- DCF Valuation (Unlevered and Levered): Customizable Discounted Cash Flow models that provide intrinsic value with comprehensive calculations.
- Financial Statements: Pre-loaded annual and quarterly financial statements to aid in your analysis.
- Key Ratios: Includes essential profitability, leverage, and efficiency ratios specific to Yunnan Shennong Agricultural Industry Group Co.,LTD. (605296SS).
- Dashboard and Charts: A visual summary of valuation outputs and assumptions for easy result analysis.
Disclaimer
All information, articles, and product details provided on this website are for general informational and educational purposes only. We do not claim any ownership over, nor do we intend to infringe upon, any trademarks, copyrights, logos, brand names, or other intellectual property mentioned or depicted on this site. Such intellectual property remains the property of its respective owners, and any references here are made solely for identification or informational purposes, without implying any affiliation, endorsement, or partnership.
We make no representations or warranties, express or implied, regarding the accuracy, completeness, or suitability of any content or products presented. Nothing on this website should be construed as legal, tax, investment, financial, medical, or other professional advice. In addition, no part of this site—including articles or product references—constitutes a solicitation, recommendation, endorsement, advertisement, or offer to buy or sell any securities, franchises, or other financial instruments, particularly in jurisdictions where such activity would be unlawful.
All content is of a general nature and may not address the specific circumstances of any individual or entity. It is not a substitute for professional advice or services. Any actions you take based on the information provided here are strictly at your own risk. You accept full responsibility for any decisions or outcomes arising from your use of this website and agree to release us from any liability in connection with your use of, or reliance upon, the content or products found herein.