
|
Guobang Pharma Ltd. (605507.SS) تقييم DCF |
Fully Editable: Tailor To Your Needs In Excel Or Sheets
Professional Design: Trusted, Industry-Standard Templates
Investor-Approved Valuation Models
MAC/PC Compatible, Fully Unlocked
No Expertise Is Needed; Easy To Follow
Guobang Pharma Ltd. (605507.SS) Bundle
اكتشف القيمة الحقيقية لـ Guobang Pharma Ltd. (605507SS) مع حاسبة DCF المهنية! اضبط الافتراضات الرئيسية ، واستكشف السيناريوهات المختلفة ، وفحص كيفية تأثير التغيرات على التقييم Guobang Pharma Ltd. (605507SS) - كل ذلك ضمن قالب Excel واحد.
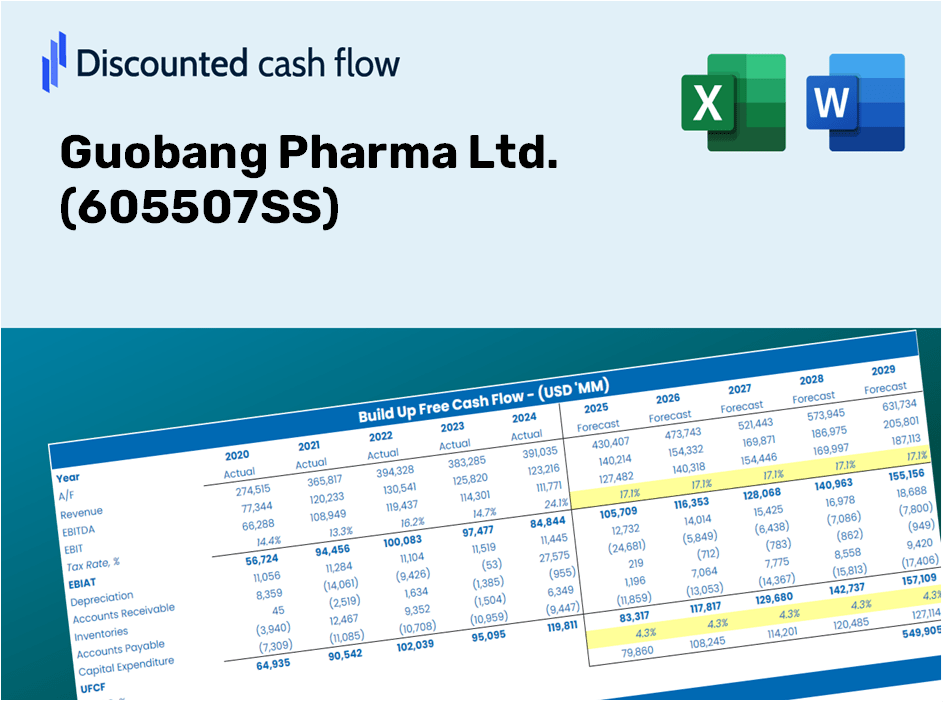
Discounted Cash Flow (DCF) - (USD MM)
| Year | AY1 2020 |
AY2 2021 |
AY3 2022 |
AY4 2023 |
AY5 2024 |
FY1 2025 |
FY2 2026 |
FY3 2027 |
FY4 2028 |
FY5 2029 |
|---|---|---|---|---|---|---|---|---|---|---|
| Revenue | 4,206.3 | 4,505.4 | 5,720.9 | 5,349.4 | 5,890.8 | 6,446.3 | 7,054.1 | 7,719.3 | 8,447.2 | 9,243.7 |
| Revenue Growth, % | 0 | 7.11 | 26.98 | -6.49 | 10.12 | 9.43 | 9.43 | 9.43 | 9.43 | 9.43 |
| EBITDA | 1,161.7 | 1,016.5 | 1,210.2 | 950.4 | 1,269.7 | 1,426.6 | 1,561.1 | 1,708.3 | 1,869.4 | 2,045.7 |
| EBITDA, % | 27.62 | 22.56 | 21.15 | 17.77 | 21.55 | 22.13 | 22.13 | 22.13 | 22.13 | 22.13 |
| Depreciation | 157.1 | 200.9 | 260.2 | 321.1 | 432.8 | 336.4 | 368.1 | 402.8 | 440.8 | 482.4 |
| Depreciation, % | 3.74 | 4.46 | 4.55 | 6 | 7.35 | 5.22 | 5.22 | 5.22 | 5.22 | 5.22 |
| EBIT | 1,004.6 | 815.6 | 950.0 | 629.3 | 836.8 | 1,090.2 | 1,193.0 | 1,305.5 | 1,428.6 | 1,563.3 |
| EBIT, % | 23.88 | 18.1 | 16.61 | 11.76 | 14.21 | 16.91 | 16.91 | 16.91 | 16.91 | 16.91 |
| Total Cash | 1,234.6 | 2,151.3 | 2,798.6 | 2,560.1 | 2,527.0 | 2,794.8 | 3,058.3 | 3,346.7 | 3,662.2 | 4,007.6 |
| Total Cash, percent | .0 | .0 | .0 | .0 | .0 | .0 | .0 | .0 | .0 | .0 |
| Account Receivables | 575.3 | 616.5 | 796.4 | 1,022.0 | 1,349.9 | 1,074.0 | 1,175.3 | 1,286.1 | 1,407.3 | 1,540.0 |
| Account Receivables, % | 13.68 | 13.68 | 13.92 | 19.1 | 22.91 | 16.66 | 16.66 | 16.66 | 16.66 | 16.66 |
| Inventories | 989.5 | 1,309.3 | 1,409.2 | 1,368.6 | 1,363.4 | 1,623.8 | 1,776.9 | 1,944.4 | 2,127.8 | 2,328.4 |
| Inventories, % | 23.53 | 29.06 | 24.63 | 25.58 | 23.14 | 25.19 | 25.19 | 25.19 | 25.19 | 25.19 |
| Accounts Payable | 1,095.7 | 789.7 | 974.3 | 1,714.6 | 1,703.7 | 1,567.5 | 1,715.3 | 1,877.1 | 2,054.1 | 2,247.7 |
| Accounts Payable, % | 26.05 | 17.53 | 17.03 | 32.05 | 28.92 | 24.32 | 24.32 | 24.32 | 24.32 | 24.32 |
| Capital Expenditure | -520.2 | -448.0 | -803.1 | -748.4 | -419.1 | -740.7 | -810.6 | -887.0 | -970.7 | -1,062.2 |
| Capital Expenditure, % | -12.37 | -9.94 | -14.04 | -13.99 | -7.11 | -11.49 | -11.49 | -11.49 | -11.49 | -11.49 |
| Tax Rate, % | 11.98 | 11.98 | 11.98 | 11.98 | 11.98 | 11.98 | 11.98 | 11.98 | 11.98 | 11.98 |
| EBITAT | 862.5 | 713.7 | 844.7 | 552.5 | 736.6 | 955.2 | 1,045.3 | 1,143.9 | 1,251.7 | 1,369.8 |
| Depreciation | ||||||||||
| Changes in Account Receivables | ||||||||||
| Changes in Inventories | ||||||||||
| Changes in Accounts Payable | ||||||||||
| Capital Expenditure | ||||||||||
| UFCF | 30.3 | -200.4 | 206.7 | 680.5 | 416.6 | 430.2 | 496.3 | 543.1 | 594.3 | 650.3 |
| WACC, % | 5.43 | 5.44 | 5.44 | 5.44 | 5.44 | 5.44 | 5.44 | 5.44 | 5.44 | 5.44 |
| PV UFCF | ||||||||||
| SUM PV UFCF | 2,297.5 | |||||||||
| Long Term Growth Rate, % | 3.00 | |||||||||
| Free cash flow (T + 1) | 670 | |||||||||
| Terminal Value | 27,458 | |||||||||
| Present Terminal Value | 21,070 | |||||||||
| Enterprise Value | 23,367 | |||||||||
| Net Debt | -1,587 | |||||||||
| Equity Value | 24,955 | |||||||||
| Diluted Shares Outstanding, MM | 558 | |||||||||
| Equity Value Per Share | 44.70 |
ما يمكنك توقعه
- دقة GBL المالية: بيانات تاريخية ومسقطة شاملة للتقييم الدقيق.
- المعلمات القابلة للتخصيص: قم بتعديل WACC ومعدلات الضرائب ونمو الإيرادات والنفقات الرأسمالية حسب الحاجة.
- الحسابات الآلية: يتم حساب القيمة الجوهرية و NPV في الوقت الفعلي.
- محاكاة السيناريو: قم بتحليل سيناريوهات مختلفة لتقييم التوقعات المستقبلية لشركة Guobang Pharma.
- واجهة سهلة الاستخدام: مصمم للمحترفين مع البقاء في متناول الوافدين الجدد.
الميزات الرئيسية
- البيانات التي تم تحميلها مسبقًا: بيانات Guobang Pharma Ltd. التاريخية والتوقعات المليئة مسبقًا.
- مدخلات قابلة للتعديل بالكامل: تعديل WACC ، ومعدلات الضرائب ، ونمو الإيرادات ، وهامش EBITDA حسب الحاجة.
- النتائج الفورية: شاهد القيمة الجوهرية لـ Guobang Pharma Ltd. في الوقت الحقيقي.
- واضحة المخرجات المرئية: تعرض مخططات لوحة القيادة نتائج التقييم ومقاييس المفاتيح.
- بنيت للدقة: أداة موثوقة مصممة للمحللين والمستثمرين والمهنيين الماليين.
كيف تعمل
- 1. الوصول إلى القالب: قم بتنزيل وفتح ملف Excel الذي يضم بيانات Guobang Pharma Ltd.'s (605507SS).
- 2. تعديل الافتراضات: ضبط المدخلات الهامة مثل معدلات النمو ، WACC ، والنفقات الرأسمالية.
- 3. تحليل النتائج على الفور: يقوم نموذج DCF تلقائيًا بحساب القيمة الجوهرية و NPV.
- 4. استكشاف السيناريوهات: تقييم التنبؤات المختلفة للتحقيق في إمكانيات التقييم المختلفة.
- 5. الحاضر مع ضمان: تقديم رؤى تقييم احترافية لدعم قراراتك.
لماذا تختار حاسبة Guobang Pharma Ltd. (605507SS)؟
- دقة: الاستفادة من البيانات المالية Guobang الحقيقية يضمن دقة استثنائية.
- التنوع: مصمم للمستخدمين لتجربة المدخلات وضبطها بحرية.
- كفاءة: تجنب تعقيد إنشاء نموذج مالي من الألف إلى الياء.
- جودة الخبراء: مصنوع بدقة وسهولة الاستخدام المتوقعة على مستوى المدير المالي.
- حدسي: سهل التنقل ، حتى بالنسبة لأولئك الذين ليس لديهم تجربة نمذجة مالية متعمقة.
من يمكنه الاستفادة من Guobang Pharma Ltd. (605507SS) ؟
- المستثمرون: قم بتقييم تقييم Guobang Pharma قبل إجراء معاملات الأسهم.
- المنظمات المالية والمحللون الماليون: تعزيز منهجيات التقييم وتقييم التوقعات المالية.
- مؤسسو الشركات الناشئة: اكتشف كيف يتم تقدير شركات الأدوية الكبيرة مثل Guobang.
- الخبراء الاستشاريون: تقديم تقارير تقييم شاملة للعملاء في قطاع الرعاية الصحية.
- الطلاب والمربون: استخدام أمثلة واقعية للممارسة والتوجيه بشأن استراتيجيات التقييم.
محتويات القالب
- البيانات التاريخية: ميزات Guobang Pharma Ltd. المعلومات المالية السابقة والتوقعات التأسيسية.
- نماذج DCF و Ruvered DCF: قوالب شاملة لتقييم القيمة الجوهرية لـ Guobang Pharma Ltd. (605507SS).
- ورقة WACC: الحسابات المسببة للتشكيل لمتوسط تكلفة رأس المال المرجح.
- مدخلات قابلة للتحرير: اضبط المحركات الهامة مثل معدلات النمو ونسب EBITDA وافتراضات Capex.
- البيانات الفصلية والسنوية: تحليل شامل للأداء المالي لـ Guobang Pharma Ltd. (605507SS).
- لوحة القيادة التفاعلية: تصور ديناميكيا نتائج التقييم والتوقعات.
Disclaimer
All information, articles, and product details provided on this website are for general informational and educational purposes only. We do not claim any ownership over, nor do we intend to infringe upon, any trademarks, copyrights, logos, brand names, or other intellectual property mentioned or depicted on this site. Such intellectual property remains the property of its respective owners, and any references here are made solely for identification or informational purposes, without implying any affiliation, endorsement, or partnership.
We make no representations or warranties, express or implied, regarding the accuracy, completeness, or suitability of any content or products presented. Nothing on this website should be construed as legal, tax, investment, financial, medical, or other professional advice. In addition, no part of this site—including articles or product references—constitutes a solicitation, recommendation, endorsement, advertisement, or offer to buy or sell any securities, franchises, or other financial instruments, particularly in jurisdictions where such activity would be unlawful.
All content is of a general nature and may not address the specific circumstances of any individual or entity. It is not a substitute for professional advice or services. Any actions you take based on the information provided here are strictly at your own risk. You accept full responsibility for any decisions or outcomes arising from your use of this website and agree to release us from any liability in connection with your use of, or reliance upon, the content or products found herein.