
|
Guobang Pharma Ltd. (605507.SS) Valoración de DCF |
Completamente Editable: Adáptelo A Sus Necesidades En Excel O Sheets
Diseño Profesional: Plantillas Confiables Y Estándares De La Industria
Predeterminadas Para Un Uso Rápido Y Eficiente
Compatible con MAC / PC, completamente desbloqueado
No Se Necesita Experiencia; Fáciles De Seguir
Guobang Pharma Ltd. (605507.SS) Bundle
¡Descubra el verdadero valor de Guobang Pharma Ltd. (605507SS) con nuestra calculadora DCF de grado profesional! Ajuste los supuestos clave, explore varios escenarios y examine cómo influyen los cambios en la valoración de Guobang Pharma Ltd. (605507SS), todo dentro de una sola plantilla de Excel.
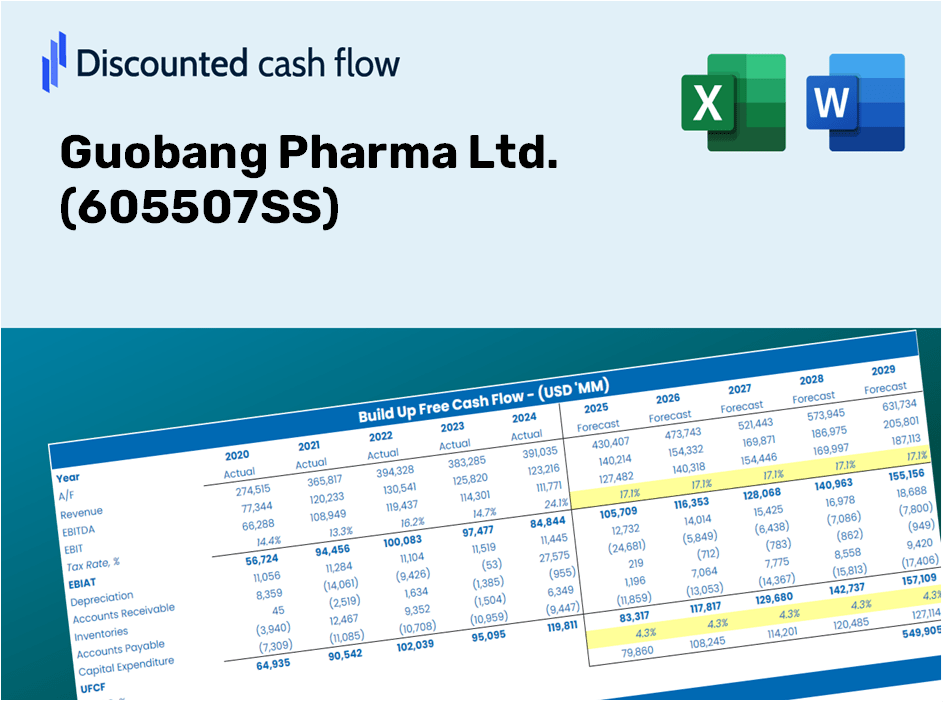
Discounted Cash Flow (DCF) - (USD MM)
| Year | AY1 2020 |
AY2 2021 |
AY3 2022 |
AY4 2023 |
AY5 2024 |
FY1 2025 |
FY2 2026 |
FY3 2027 |
FY4 2028 |
FY5 2029 |
|---|---|---|---|---|---|---|---|---|---|---|
| Revenue | 4,206.3 | 4,505.4 | 5,720.9 | 5,349.4 | 5,890.8 | 6,446.3 | 7,054.1 | 7,719.3 | 8,447.2 | 9,243.7 |
| Revenue Growth, % | 0 | 7.11 | 26.98 | -6.49 | 10.12 | 9.43 | 9.43 | 9.43 | 9.43 | 9.43 |
| EBITDA | 1,161.7 | 1,016.5 | 1,210.2 | 950.4 | 1,269.7 | 1,426.6 | 1,561.1 | 1,708.3 | 1,869.4 | 2,045.7 |
| EBITDA, % | 27.62 | 22.56 | 21.15 | 17.77 | 21.55 | 22.13 | 22.13 | 22.13 | 22.13 | 22.13 |
| Depreciation | 157.1 | 200.9 | 260.2 | 321.1 | 432.8 | 336.4 | 368.1 | 402.8 | 440.8 | 482.4 |
| Depreciation, % | 3.74 | 4.46 | 4.55 | 6 | 7.35 | 5.22 | 5.22 | 5.22 | 5.22 | 5.22 |
| EBIT | 1,004.6 | 815.6 | 950.0 | 629.3 | 836.8 | 1,090.2 | 1,193.0 | 1,305.5 | 1,428.6 | 1,563.3 |
| EBIT, % | 23.88 | 18.1 | 16.61 | 11.76 | 14.21 | 16.91 | 16.91 | 16.91 | 16.91 | 16.91 |
| Total Cash | 1,234.6 | 2,151.3 | 2,798.6 | 2,560.1 | 2,527.0 | 2,794.8 | 3,058.3 | 3,346.7 | 3,662.2 | 4,007.6 |
| Total Cash, percent | .0 | .0 | .0 | .0 | .0 | .0 | .0 | .0 | .0 | .0 |
| Account Receivables | 575.3 | 616.5 | 796.4 | 1,022.0 | 1,349.9 | 1,074.0 | 1,175.3 | 1,286.1 | 1,407.3 | 1,540.0 |
| Account Receivables, % | 13.68 | 13.68 | 13.92 | 19.1 | 22.91 | 16.66 | 16.66 | 16.66 | 16.66 | 16.66 |
| Inventories | 989.5 | 1,309.3 | 1,409.2 | 1,368.6 | 1,363.4 | 1,623.8 | 1,776.9 | 1,944.4 | 2,127.8 | 2,328.4 |
| Inventories, % | 23.53 | 29.06 | 24.63 | 25.58 | 23.14 | 25.19 | 25.19 | 25.19 | 25.19 | 25.19 |
| Accounts Payable | 1,095.7 | 789.7 | 974.3 | 1,714.6 | 1,703.7 | 1,567.5 | 1,715.3 | 1,877.1 | 2,054.1 | 2,247.7 |
| Accounts Payable, % | 26.05 | 17.53 | 17.03 | 32.05 | 28.92 | 24.32 | 24.32 | 24.32 | 24.32 | 24.32 |
| Capital Expenditure | -520.2 | -448.0 | -803.1 | -748.4 | -419.1 | -740.7 | -810.6 | -887.0 | -970.7 | -1,062.2 |
| Capital Expenditure, % | -12.37 | -9.94 | -14.04 | -13.99 | -7.11 | -11.49 | -11.49 | -11.49 | -11.49 | -11.49 |
| Tax Rate, % | 11.98 | 11.98 | 11.98 | 11.98 | 11.98 | 11.98 | 11.98 | 11.98 | 11.98 | 11.98 |
| EBITAT | 862.5 | 713.7 | 844.7 | 552.5 | 736.6 | 955.2 | 1,045.3 | 1,143.9 | 1,251.7 | 1,369.8 |
| Depreciation | ||||||||||
| Changes in Account Receivables | ||||||||||
| Changes in Inventories | ||||||||||
| Changes in Accounts Payable | ||||||||||
| Capital Expenditure | ||||||||||
| UFCF | 30.3 | -200.4 | 206.7 | 680.5 | 416.6 | 430.2 | 496.3 | 543.1 | 594.3 | 650.3 |
| WACC, % | 5.43 | 5.44 | 5.44 | 5.44 | 5.44 | 5.44 | 5.44 | 5.44 | 5.44 | 5.44 |
| PV UFCF | ||||||||||
| SUM PV UFCF | 2,297.5 | |||||||||
| Long Term Growth Rate, % | 3.00 | |||||||||
| Free cash flow (T + 1) | 670 | |||||||||
| Terminal Value | 27,458 | |||||||||
| Present Terminal Value | 21,070 | |||||||||
| Enterprise Value | 23,367 | |||||||||
| Net Debt | -1,587 | |||||||||
| Equity Value | 24,955 | |||||||||
| Diluted Shares Outstanding, MM | 558 | |||||||||
| Equity Value Per Share | 44.70 |
What You Can Expect
- Accurate GBL Financials: Comprehensive historical and projected data for precise valuation.
- Customizable Parameters: Adjust WACC, tax rates, revenue growth, and capital expenditures as needed.
- Automated Calculations: Intrinsic value and NPV are computed in real-time.
- Scenario Simulation: Analyze various scenarios to assess Guobang Pharma's future outlook.
- User-Friendly Interface: Designed for professionals while remaining accessible to newcomers.
Key Features
- Pre-Loaded Data: Guobang Pharma Ltd.'s historical financial statements and pre-filled forecasts.
- Fully Adjustable Inputs: Modify WACC, tax rates, revenue growth, and EBITDA margins as needed.
- Instant Results: Watch Guobang Pharma Ltd.'s intrinsic value recalculate in real time.
- Clear Visual Outputs: Dashboard charts showcase valuation results and key metrics.
- Built for Accuracy: A reliable tool designed for analysts, investors, and finance professionals.
How It Operates
- 1. Access the Template: Download and open the Excel file featuring Guobang Pharma Ltd.'s (605507SS) preloaded data.
- 2. Modify Assumptions: Adjust critical inputs such as growth rates, WACC, and capital expenditures.
- 3. Analyze Results Instantly: The DCF model automatically computes intrinsic value and NPV.
- 4. Explore Scenarios: Evaluate various forecasts to investigate different valuation possibilities.
- 5. Present with Assurance: Deliver professional valuation insights to back your decisions.
Why Choose Guobang Pharma Ltd. (605507SS) Calculator?
- Precision: Leveraging real Guobang financial data ensures exceptional accuracy.
- Versatility: Tailored for users to freely experiment with and adjust inputs.
- Efficiency: Avoid the complexity of creating a financial model from the ground up.
- Expert-Quality: Crafted with the precision and usability expected at the CFO level.
- Intuitive: Simple to navigate, even for those without in-depth financial modeling experience.
Who Can Benefit from Guobang Pharma Ltd. (605507SS)?
- Investors: Assess Guobang Pharma's valuation prior to making stock transactions.
- CFOs and Financial Analysts: Enhance valuation methodologies and evaluate financial forecasts.
- Startup Founders: Discover how large pharmaceutical companies like Guobang are valued.
- Consultants: Provide comprehensive valuation reports for clients in the healthcare sector.
- Students and Educators: Utilize real-world examples to practice and instruct on valuation strategies.
Contents of the Template
- Historical Data: Features Guobang Pharma Ltd.'s past financial information and foundational forecasts.
- DCF and Levered DCF Models: Comprehensive templates for assessing the intrinsic value of Guobang Pharma Ltd. (605507SS).
- WACC Sheet: Pre-configured calculations for Weighted Average Cost of Capital.
- Editable Inputs: Adjust critical drivers such as growth rates, EBITDA percentages, and CAPEX assumptions.
- Quarterly and Annual Statements: A thorough analysis of Guobang Pharma Ltd. (605507SS)'s financial performance.
- Interactive Dashboard: Dynamically visualize valuation outcomes and forecasts.
Disclaimer
All information, articles, and product details provided on this website are for general informational and educational purposes only. We do not claim any ownership over, nor do we intend to infringe upon, any trademarks, copyrights, logos, brand names, or other intellectual property mentioned or depicted on this site. Such intellectual property remains the property of its respective owners, and any references here are made solely for identification or informational purposes, without implying any affiliation, endorsement, or partnership.
We make no representations or warranties, express or implied, regarding the accuracy, completeness, or suitability of any content or products presented. Nothing on this website should be construed as legal, tax, investment, financial, medical, or other professional advice. In addition, no part of this site—including articles or product references—constitutes a solicitation, recommendation, endorsement, advertisement, or offer to buy or sell any securities, franchises, or other financial instruments, particularly in jurisdictions where such activity would be unlawful.
All content is of a general nature and may not address the specific circumstances of any individual or entity. It is not a substitute for professional advice or services. Any actions you take based on the information provided here are strictly at your own risk. You accept full responsibility for any decisions or outcomes arising from your use of this website and agree to release us from any liability in connection with your use of, or reliance upon, the content or products found herein.