
|
Fukushima Galilei Co.Ltd. (6420.T) تقييم DCF |
Fully Editable: Tailor To Your Needs In Excel Or Sheets
Professional Design: Trusted, Industry-Standard Templates
Investor-Approved Valuation Models
MAC/PC Compatible, Fully Unlocked
No Expertise Is Needed; Easy To Follow
Fukushima Galilei Co.Ltd. (6420.T) Bundle
عزز خيارات الاستثمار الخاصة بك مع حاسبة (6420T) DCF! تحليل الأصيل Fukushima Galilei Co.Ltd. البيانات المالية ، وضبط تنبؤات النمو والنفقات ، ومراقبة الآثار الفورية لهذه التغييرات على القيمة الجوهرية لـ (6420T).
Discounted Cash Flow (DCF) - (USD MM)
| Year | AY1 2021 |
AY2 2022 |
AY3 2023 |
AY4 2024 |
AY5 2025 |
FY1 2026 |
FY2 2027 |
FY3 2028 |
FY4 2029 |
FY5 2030 |
|---|---|---|---|---|---|---|---|---|---|---|
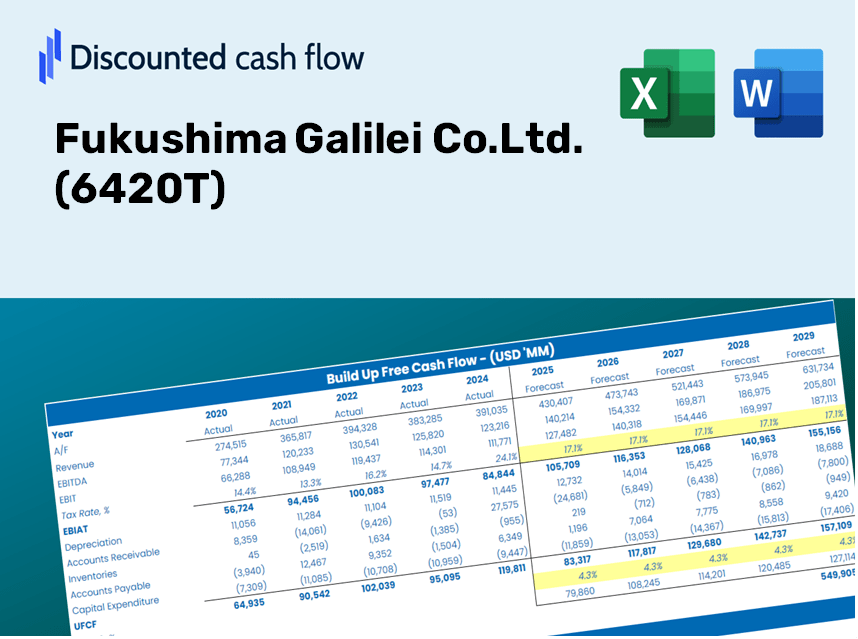
| Revenue | 82,451.0 | 96,073.0 | 104,996.0 | 115,815.0 | 130,639.0 | 146,613.9 | 164,542.2 | 184,662.8 | 207,243.8 | 232,586.1 |
| Revenue Growth, % | 0 | 16.52 | 9.29 | 10.3 | 12.8 | 12.23 | 12.23 | 12.23 | 12.23 | 12.23 |
| EBITDA | 10,771.0 | 12,630.0 | 12,780.0 | 16,576.0 | 18,942.0 | 19,703.0 | 22,112.4 | 24,816.3 | 27,850.9 | 31,256.6 |
| EBITDA, % | 13.06 | 13.15 | 12.17 | 14.31 | 14.5 | 13.44 | 13.44 | 13.44 | 13.44 | 13.44 |
| Depreciation | 1,628.0 | 1,367.0 | 1,289.0 | 1,349.0 | 1,569.0 | 2,049.9 | 2,300.6 | 2,581.9 | 2,897.6 | 3,252.0 |
| Depreciation, % | 1.97 | 1.42 | 1.23 | 1.16 | 1.2 | 1.4 | 1.4 | 1.4 | 1.4 | 1.4 |
| EBIT | 9,143.0 | 11,263.0 | 11,491.0 | 15,227.0 | 17,373.0 | 17,653.1 | 19,811.8 | 22,234.4 | 24,953.3 | 28,004.7 |
| EBIT, % | 11.09 | 11.72 | 10.94 | 13.15 | 13.3 | 12.04 | 12.04 | 12.04 | 12.04 | 12.04 |
| Total Cash | 39,918.0 | 44,164.0 | 46,392.0 | 54,236.0 | 53,408.0 | 66,351.6 | 74,465.2 | 83,571.0 | 93,790.2 | 105,259.1 |
| Total Cash, percent | .0 | .0 | .0 | .0 | .0 | .0 | .0 | .0 | .0 | .0 |
| Account Receivables | 19,549.0 | 21,748.0 | 24,871.0 | 28,792.0 | 30,759.0 | 34,729.8 | 38,976.7 | 43,742.8 | 49,091.8 | 55,094.9 |
| Account Receivables, % | 23.71 | 22.64 | 23.69 | 24.86 | 23.55 | 23.69 | 23.69 | 23.69 | 23.69 | 23.69 |
| Inventories | 5,997.0 | 6,148.0 | 8,536.0 | 8,389.0 | 10,849.0 | 10,952.2 | 12,291.5 | 13,794.5 | 15,481.3 | 17,374.4 |
| Inventories, % | 7.27 | 6.4 | 8.13 | 7.24 | 8.3 | 7.47 | 7.47 | 7.47 | 7.47 | 7.47 |
| Accounts Payable | 20,835.0 | 21,749.0 | 20,760.0 | 20,760.0 | 22,672.0 | 30,190.6 | 33,882.4 | 38,025.6 | 42,675.5 | 47,893.9 |
| Accounts Payable, % | 25.27 | 22.64 | 19.77 | 17.93 | 17.35 | 20.59 | 20.59 | 20.59 | 20.59 | 20.59 |
| Capital Expenditure | -1,676.0 | -1,367.0 | -2,009.0 | -2,382.0 | -7,264.0 | -3,807.9 | -4,273.5 | -4,796.1 | -5,382.6 | -6,040.8 |
| Capital Expenditure, % | -2.03 | -1.42 | -1.91 | -2.06 | -5.56 | -2.6 | -2.6 | -2.6 | -2.6 | -2.6 |
| Tax Rate, % | 29.87 | 29.87 | 29.87 | 29.87 | 29.87 | 29.87 | 29.87 | 29.87 | 29.87 | 29.87 |
| EBITAT | 6,312.1 | 8,170.5 | 8,098.6 | 11,535.5 | 12,183.3 | 12,637.7 | 14,183.0 | 15,917.4 | 17,863.8 | 20,048.2 |
| Depreciation | ||||||||||
| Changes in Account Receivables | ||||||||||
| Changes in Inventories | ||||||||||
| Changes in Accounts Payable | ||||||||||
| Capital Expenditure | ||||||||||
| UFCF | 1,553.1 | 6,734.5 | 878.6 | 6,728.5 | 3,973.3 | 14,324.3 | 10,315.8 | 11,577.2 | 12,992.9 | 14,581.7 |
| WACC, % | 5.37 | 5.37 | 5.37 | 5.37 | 5.37 | 5.37 | 5.37 | 5.37 | 5.37 | 5.37 |
| PV UFCF | ||||||||||
| SUM PV UFCF | 54,546.1 | |||||||||
| Long Term Growth Rate, % | 0.50 | |||||||||
| Free cash flow (T + 1) | 14,655 | |||||||||
| Terminal Value | 300,876 | |||||||||
| Present Terminal Value | 231,627 | |||||||||
| Enterprise Value | 286,173 | |||||||||
| Net Debt | -53,408 | |||||||||
| Equity Value | 339,581 | |||||||||
| Diluted Shares Outstanding, MM | 40 | |||||||||
| Equity Value Per Share | 8,477.86 |
ماذا ستتلقى
- بيانات Fukushima Galilei الأصلية: البيانات المالية الشاملة - تمتد إيرادات إلى EBIT - بناءً على كل من البيانات التاريخية والمتوقعة.
- التخصيص الكامل: تعديل المعلمات الأساسية (الخلايا المميزة) مثل WACC و Growth ٪ ومعدلات الضرائب.
- تعديلات التقييم الفوري: عمليات إعادة حساب تلقائية لتقييم تأثيرات التغييرات على القيمة العادلة لفوكوشيما غاليلي.
- قالب Excel المرن: تم تصميمه للتعديلات دون عناء ، وتحليل السيناريو ، والتوقعات الشاملة.
- كفاءة ودقيقة: تجنب متاعب بناء نماذج من الألف إلى الياء مع ضمان الدقة والقدرة على التكيف.
الميزات الرئيسية
- 🔍 البيانات المالية (6420T): البيانات التاريخية والمتوقعة المليئة مسبقًا لشركة Fukushima Galilei Co. ، Ltd.
- ✏️ مدخلات قابلة للتخصيص بالكامل: اضبط جميع المعلمات الرئيسية (الخلايا الصفراء) مثل WACC و Growth ٪ ومعدلات الضرائب.
- 📊 تقييم DCF المهني: الصيغ المدمجة حساب القيمة الجوهرية لفوكوشيما غاليلي باستخدام طريقة التدفق النقدي المخفض.
- ⚡ النتائج الفورية: تصور تقييم فوكوشيما غاليلي على الفور بعد إجراء تعديلات.
- تحليل السيناريو: اختبار ومقارنة نتائج الافتراضات المالية المختلفة جنبًا إلى جنب.
كيف تعمل
- الخطوة 1: قم بتنزيل ملف Excel.
- الخطوة 2: فحص بيانات Fukushima Galilei Co. Ltd. (6420T) المليئة (التاريخية والمتوقعة).
- الخطوة 3: تعديل الافتراضات الرئيسية (الخلايا الصفراء) وفقا لرؤيتك.
- الخطوة 4: راقب عمليات إعادة الحساب التلقائية للقيمة الجوهرية لشركة Fukushima Galilei Co. Ltd. (6420T).
- الخطوة 5: الاستفادة من مخرجات تحليل الاستثمار أو التقارير.
لماذا تختار حاسبة Fukushima Galilei Co. Ltd.؟
- واجهة سهلة الاستخدام: مناسبة لكل من الوافدين الجدد والمهنيين المحنكين.
- مدخلات قابلة للتخصيص: تعديل المعلمات دون عناء للتوافق مع احتياجات التحليل.
- تحديثات التقييم في الوقت الحقيقي: تجربة تغييرات فورية في تقييم فوكوشيما غاليلي أثناء ضبط المدخلات.
- بيانات تم تكوينها مسبقًا: يأتي مع المقاييس المالية الفعلية لفوكوشيما غاليلي لتحليل سريع وفعال.
- اعتمد عليه الخبراء: أداة يثق بها المستثمرون والمحللين لاتخاذ قرارات مستنيرة.
من يمكنه الاستفادة من هذا المنتج ؟
- المستثمرون: تقييم القيمة العادلة لشركة Fukushima Galilei Co. المحدودة (6420T) قبل اتخاذ خيارات الاستثمار.
- المنظمات المالية: استخدام نموذج عالي الجودة لإعداد تقارير وتحليلات مالية شاملة.
- الخبراء الاستشاريون: تخصيص النموذج بسهولة لتقارير تقييم العملاء.
- أصحاب المشاريع: اكتشاف تقنيات النمذجة المالية المطبقة من قبل الشركات الرائدة.
- المعلمون: استخدمه كمورد لتعليم منهجيات التقييم المختلفة.
محتويات القالب
- نموذج DCF المليء مسبقًا: Fukushima Galilei Co. Ltd.'s (6420T) البيانات المالية جاهزة للتطبيق الفوري.
- حاسبة WACC: حسابات شاملة لمتوسط تكلفة رأس المال المرجح.
- النسب المالية: تقييم ربحية فوكوشيما غاليلي والرافعة المالية والكفاءة التشغيلية.
- مدخلات قابلة للتحرير: تعديل المعلمات مثل معدلات النمو ، هوامش الربح ، و Capex لتناسب تحليلك.
- البيانات المالية: الوصول إلى التقارير السنوية والفصلية للتقييم المتعمق.
- لوحة القيادة التفاعلية: تصور دون عناء مقاييس التقييم الرئيسية والنتائج.
Disclaimer
All information, articles, and product details provided on this website are for general informational and educational purposes only. We do not claim any ownership over, nor do we intend to infringe upon, any trademarks, copyrights, logos, brand names, or other intellectual property mentioned or depicted on this site. Such intellectual property remains the property of its respective owners, and any references here are made solely for identification or informational purposes, without implying any affiliation, endorsement, or partnership.
We make no representations or warranties, express or implied, regarding the accuracy, completeness, or suitability of any content or products presented. Nothing on this website should be construed as legal, tax, investment, financial, medical, or other professional advice. In addition, no part of this site—including articles or product references—constitutes a solicitation, recommendation, endorsement, advertisement, or offer to buy or sell any securities, franchises, or other financial instruments, particularly in jurisdictions where such activity would be unlawful.
All content is of a general nature and may not address the specific circumstances of any individual or entity. It is not a substitute for professional advice or services. Any actions you take based on the information provided here are strictly at your own risk. You accept full responsibility for any decisions or outcomes arising from your use of this website and agree to release us from any liability in connection with your use of, or reliance upon, the content or products found herein.