
|
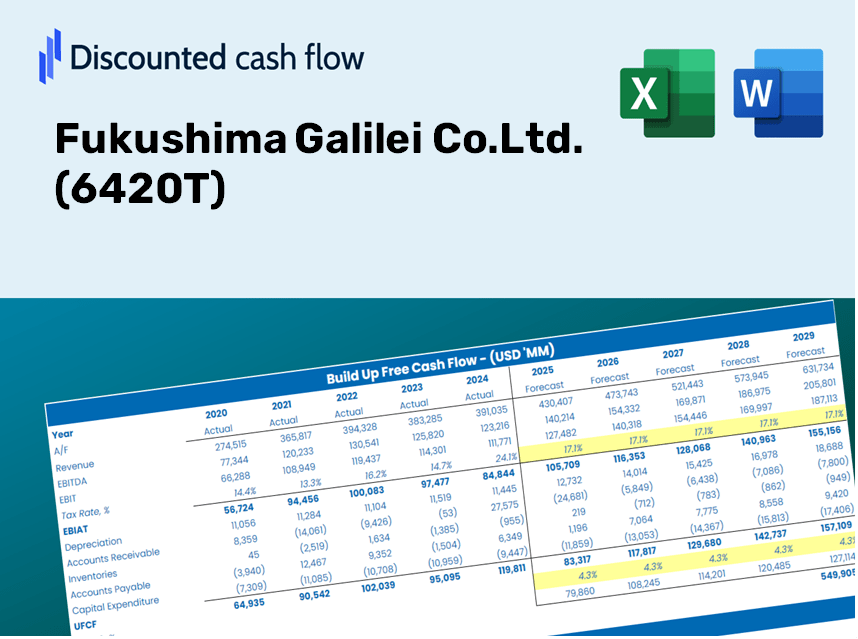
Fukushima Galilei Co.Ltd. (6420.T) DCF Valuation |
Fully Editable: Tailor To Your Needs In Excel Or Sheets
Professional Design: Trusted, Industry-Standard Templates
Investor-Approved Valuation Models
MAC/PC Compatible, Fully Unlocked
No Expertise Is Needed; Easy To Follow
Fukushima Galilei Co.Ltd. (6420.T) Bundle
Enhance your investment choices with the (6420T) DCF Calculator! Analyze authentic Fukushima Galilei Co.Ltd. financials, adjust growth predictions and expenses, and observe the immediate effects of these changes on the intrinsic value of (6420T).
Discounted Cash Flow (DCF) - (USD MM)
| Year | AY1 2021 |
AY2 2022 |
AY3 2023 |
AY4 2024 |
AY5 2025 |
FY1 2026 |
FY2 2027 |
FY3 2028 |
FY4 2029 |
FY5 2030 |
|---|---|---|---|---|---|---|---|---|---|---|
| Revenue | 82,451.0 | 96,073.0 | 104,996.0 | 115,815.0 | 130,639.0 | 146,613.9 | 164,542.2 | 184,662.8 | 207,243.8 | 232,586.1 |
| Revenue Growth, % | 0 | 16.52 | 9.29 | 10.3 | 12.8 | 12.23 | 12.23 | 12.23 | 12.23 | 12.23 |
| EBITDA | 10,771.0 | 12,630.0 | 12,780.0 | 16,576.0 | 18,942.0 | 19,703.0 | 22,112.4 | 24,816.3 | 27,850.9 | 31,256.6 |
| EBITDA, % | 13.06 | 13.15 | 12.17 | 14.31 | 14.5 | 13.44 | 13.44 | 13.44 | 13.44 | 13.44 |
| Depreciation | 1,628.0 | 1,367.0 | 1,289.0 | 1,349.0 | 1,569.0 | 2,049.9 | 2,300.6 | 2,581.9 | 2,897.6 | 3,252.0 |
| Depreciation, % | 1.97 | 1.42 | 1.23 | 1.16 | 1.2 | 1.4 | 1.4 | 1.4 | 1.4 | 1.4 |
| EBIT | 9,143.0 | 11,263.0 | 11,491.0 | 15,227.0 | 17,373.0 | 17,653.1 | 19,811.8 | 22,234.4 | 24,953.3 | 28,004.7 |
| EBIT, % | 11.09 | 11.72 | 10.94 | 13.15 | 13.3 | 12.04 | 12.04 | 12.04 | 12.04 | 12.04 |
| Total Cash | 39,918.0 | 44,164.0 | 46,392.0 | 54,236.0 | 53,408.0 | 66,351.6 | 74,465.2 | 83,571.0 | 93,790.2 | 105,259.1 |
| Total Cash, percent | .0 | .0 | .0 | .0 | .0 | .0 | .0 | .0 | .0 | .0 |
| Account Receivables | 19,549.0 | 21,748.0 | 24,871.0 | 28,792.0 | 30,759.0 | 34,729.8 | 38,976.7 | 43,742.8 | 49,091.8 | 55,094.9 |
| Account Receivables, % | 23.71 | 22.64 | 23.69 | 24.86 | 23.55 | 23.69 | 23.69 | 23.69 | 23.69 | 23.69 |
| Inventories | 5,997.0 | 6,148.0 | 8,536.0 | 8,389.0 | 10,849.0 | 10,952.2 | 12,291.5 | 13,794.5 | 15,481.3 | 17,374.4 |
| Inventories, % | 7.27 | 6.4 | 8.13 | 7.24 | 8.3 | 7.47 | 7.47 | 7.47 | 7.47 | 7.47 |
| Accounts Payable | 20,835.0 | 21,749.0 | 20,760.0 | 20,760.0 | 22,672.0 | 30,190.6 | 33,882.4 | 38,025.6 | 42,675.5 | 47,893.9 |
| Accounts Payable, % | 25.27 | 22.64 | 19.77 | 17.93 | 17.35 | 20.59 | 20.59 | 20.59 | 20.59 | 20.59 |
| Capital Expenditure | -1,676.0 | -1,367.0 | -2,009.0 | -2,382.0 | -7,264.0 | -3,807.9 | -4,273.5 | -4,796.1 | -5,382.6 | -6,040.8 |
| Capital Expenditure, % | -2.03 | -1.42 | -1.91 | -2.06 | -5.56 | -2.6 | -2.6 | -2.6 | -2.6 | -2.6 |
| Tax Rate, % | 29.87 | 29.87 | 29.87 | 29.87 | 29.87 | 29.87 | 29.87 | 29.87 | 29.87 | 29.87 |
| EBITAT | 6,312.1 | 8,170.5 | 8,098.6 | 11,535.5 | 12,183.3 | 12,637.7 | 14,183.0 | 15,917.4 | 17,863.8 | 20,048.2 |
| Depreciation | ||||||||||
| Changes in Account Receivables | ||||||||||
| Changes in Inventories | ||||||||||
| Changes in Accounts Payable | ||||||||||
| Capital Expenditure | ||||||||||
| UFCF | 1,553.1 | 6,734.5 | 878.6 | 6,728.5 | 3,973.3 | 14,324.3 | 10,315.8 | 11,577.2 | 12,992.9 | 14,581.7 |
| WACC, % | 5.37 | 5.37 | 5.37 | 5.37 | 5.37 | 5.37 | 5.37 | 5.37 | 5.37 | 5.37 |
| PV UFCF | ||||||||||
| SUM PV UFCF | 54,546.1 | |||||||||
| Long Term Growth Rate, % | 0.50 | |||||||||
| Free cash flow (T + 1) | 14,655 | |||||||||
| Terminal Value | 300,876 | |||||||||
| Present Terminal Value | 231,627 | |||||||||
| Enterprise Value | 286,173 | |||||||||
| Net Debt | -53,408 | |||||||||
| Equity Value | 339,581 | |||||||||
| Diluted Shares Outstanding, MM | 40 | |||||||||
| Equity Value Per Share | 8,477.86 |
What You Will Receive
- Authentic Fukushima Galilei Data: Comprehensive financials – spanning revenue to EBIT – based on both historical and projected data.
- Complete Customization: Modify essential parameters (highlighted cells) such as WACC, growth %, and tax rates.
- Immediate Valuation Adjustments: Automatic recalculations to assess the effects of changes on Fukushima Galilei’s fair value.
- Flexible Excel Template: Designed for effortless edits, scenario analysis, and thorough projections.
- Efficient and Precise: Avoid the hassle of building models from the ground up while ensuring accuracy and adaptability.
Key Features
- 🔍 Real-Life (6420T) Financials: Pre-filled historical and projected data for Fukushima Galilei Co., Ltd.
- ✏️ Fully Customizable Inputs: Adjust all key parameters (yellow cells) such as WACC, growth %, and tax rates.
- 📊 Professional DCF Valuation: Built-in formulas calculate the intrinsic value of Fukushima Galilei using the Discounted Cash Flow method.
- ⚡ Instant Results: Visualize the valuation of Fukushima Galilei instantly after making adjustments.
- Scenario Analysis: Test and compare outcomes for different financial assumptions side-by-side.
How It Works
- Step 1: Download the Excel file.
- Step 2: Examine the pre-filled Fukushima Galilei Co. Ltd. (6420T) data (historical and forecasted).
- Step 3: Modify key assumptions (yellow cells) according to your insights.
- Step 4: Observe the automatic recalculations for the intrinsic value of Fukushima Galilei Co. Ltd. (6420T).
- Step 5: Utilize the outputs for investment analysis or reporting.
Why Choose Fukushima Galilei Co. Ltd. Calculator?
- User-Friendly Interface: Suitable for both newcomers and seasoned professionals.
- Customizable Inputs: Modify parameters effortlessly to align with your analysis needs.
- Real-Time Valuation Updates: Experience immediate changes in Fukushima Galilei's valuation as you adjust the inputs.
- Pre-Configured Data: Comes with Fukushima Galilei's actual financial metrics for fast and effective analysis.
- Relied Upon by Experts: A tool trusted by investors and analysts for making well-informed decisions.
Who Can Benefit from This Product?
- Investors: Evaluate the fair value of Fukushima Galilei Co. Ltd. (6420T) before making investment choices.
- CFOs: Utilize a high-quality DCF model for comprehensive financial reporting and analysis.
- Consultants: Easily customize the template for client valuation reports.
- Entrepreneurs: Discover financial modeling techniques applied by leading companies.
- Educators: Employ it as a resource to teach various valuation methodologies.
Contents of the Template
- Pre-Filled DCF Model: Fukushima Galilei Co. Ltd.'s (6420T) financial data ready for immediate application.
- WACC Calculator: Comprehensive calculations for the Weighted Average Cost of Capital.
- Financial Ratios: Assess Fukushima Galilei's profitability, leverage, and operational efficiency.
- Editable Inputs: Modify parameters such as growth rates, profit margins, and CAPEX to suit your analysis.
- Financial Statements: Access annual and quarterly reports for in-depth evaluation.
- Interactive Dashboard: Effortlessly visualize key valuation metrics and outcomes.
Disclaimer
All information, articles, and product details provided on this website are for general informational and educational purposes only. We do not claim any ownership over, nor do we intend to infringe upon, any trademarks, copyrights, logos, brand names, or other intellectual property mentioned or depicted on this site. Such intellectual property remains the property of its respective owners, and any references here are made solely for identification or informational purposes, without implying any affiliation, endorsement, or partnership.
We make no representations or warranties, express or implied, regarding the accuracy, completeness, or suitability of any content or products presented. Nothing on this website should be construed as legal, tax, investment, financial, medical, or other professional advice. In addition, no part of this site—including articles or product references—constitutes a solicitation, recommendation, endorsement, advertisement, or offer to buy or sell any securities, franchises, or other financial instruments, particularly in jurisdictions where such activity would be unlawful.
All content is of a general nature and may not address the specific circumstances of any individual or entity. It is not a substitute for professional advice or services. Any actions you take based on the information provided here are strictly at your own risk. You accept full responsibility for any decisions or outcomes arising from your use of this website and agree to release us from any liability in connection with your use of, or reliance upon, the content or products found herein.