
|
شركة Shenzhen Transsion Holdings Co. ، Ltd. (688036.SS) تقييم DCF |
Fully Editable: Tailor To Your Needs In Excel Or Sheets
Professional Design: Trusted, Industry-Standard Templates
Investor-Approved Valuation Models
MAC/PC Compatible, Fully Unlocked
No Expertise Is Needed; Easy To Follow
Shenzhen Transsion Holdings Co., Ltd. (688036.SS) Bundle
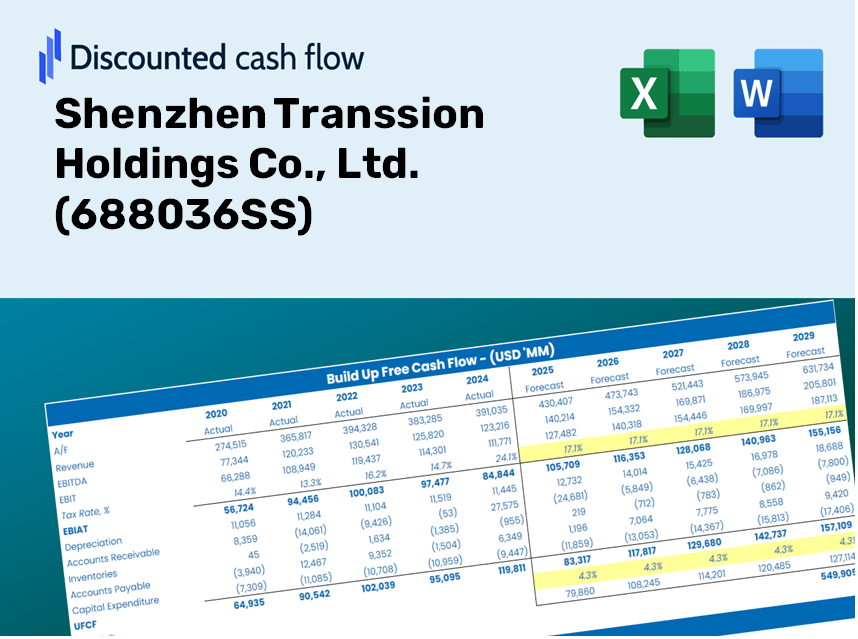
اكتساب رؤى في شركة Shenzhen Transsion Holdings Co. ، Ltd. (688036SS) تحليل التقييم باستخدام حاسبة DCF المتطورة! يأتي قالب Excel هذا مسبقًا ببيانات أصلية (688036SS) ، مما يتيح لك ضبط التوقعات والافتراضات لحساب دقيق لقيمة شنتشن ترانسون هولدنغز الجوهرية.
Discounted Cash Flow (DCF) - (USD MM)
| Year | AY1 2020 |
AY2 2021 |
AY3 2022 |
AY4 2023 |
AY5 2024 |
FY1 2025 |
FY2 2026 |
FY3 2027 |
FY4 2028 |
FY5 2029 |
|---|---|---|---|---|---|---|---|---|---|---|
| Revenue | 37,791.9 | 49,411.9 | 46,595.9 | 62,294.9 | 68,715.3 | 80,576.7 | 94,485.5 | 110,795.3 | 129,920.3 | 152,346.7 |
| Revenue Growth, % | 0 | 30.75 | -5.7 | 33.69 | 10.31 | 17.26 | 17.26 | 17.26 | 17.26 | 17.26 |
| EBITDA | 3,562.5 | 4,381.2 | 2,854.6 | 6,392.6 | 5,549.5 | 6,890.5 | 8,079.9 | 9,474.6 | 11,110.1 | 13,027.9 |
| EBITDA, % | 9.43 | 8.87 | 6.13 | 10.26 | 8.08 | 8.55 | 8.55 | 8.55 | 8.55 | 8.55 |
| Depreciation | 126.3 | 126.3 | 148.8 | 211.8 | 272.9 | 265.3 | 311.1 | 364.8 | 427.7 | 501.6 |
| Depreciation, % | 0.33413 | 0.25556 | 0.31944 | 0.33993 | 0.39711 | 0.32923 | 0.32923 | 0.32923 | 0.32923 | 0.32923 |
| EBIT | 3,436.3 | 4,254.9 | 2,705.7 | 6,180.8 | 5,276.6 | 6,625.2 | 7,768.8 | 9,109.9 | 10,682.4 | 12,526.3 |
| EBIT, % | 9.09 | 8.61 | 5.81 | 9.92 | 7.68 | 8.22 | 8.22 | 8.22 | 8.22 | 8.22 |
| Total Cash | 14,614.8 | 16,391.0 | 16,837.2 | 26,117.5 | 24,815.3 | 29,977.3 | 35,151.9 | 41,219.6 | 48,334.8 | 56,678.2 |
| Total Cash, percent | .0 | .0 | .0 | .0 | .0 | .0 | .0 | .0 | .0 | .0 |
| Account Receivables | 1,963.7 | 1,230.3 | 1,885.3 | 2,866.3 | 4,595.2 | 3,709.8 | 4,350.2 | 5,101.1 | 5,981.7 | 7,014.2 |
| Account Receivables, % | 5.2 | 2.49 | 4.05 | 4.6 | 6.69 | 4.6 | 4.6 | 4.6 | 4.6 | 4.6 |
| Inventories | 5,551.9 | 7,578.8 | 6,083.9 | 10,443.4 | 8,663.4 | 11,676.8 | 13,692.4 | 16,055.9 | 18,827.4 | 22,077.3 |
| Inventories, % | 14.69 | 15.34 | 13.06 | 16.76 | 12.61 | 14.49 | 14.49 | 14.49 | 14.49 | 14.49 |
| Accounts Payable | 10,547.6 | 8,799.8 | 7,943.8 | 18,718.6 | 17,212.9 | 18,994.4 | 22,273.1 | 26,117.8 | 30,626.2 | 35,912.7 |
| Accounts Payable, % | 27.91 | 17.81 | 17.05 | 30.05 | 25.05 | 23.57 | 23.57 | 23.57 | 23.57 | 23.57 |
| Capital Expenditure | -319.0 | -740.2 | -840.1 | -822.6 | -640.2 | -1,030.9 | -1,208.8 | -1,417.5 | -1,662.2 | -1,949.1 |
| Capital Expenditure, % | -0.84398 | -1.5 | -1.8 | -1.32 | -0.93166 | -1.28 | -1.28 | -1.28 | -1.28 | -1.28 |
| Tax Rate, % | 16.9 | 16.9 | 16.9 | 16.9 | 16.9 | 16.9 | 16.9 | 16.9 | 16.9 | 16.9 |
| EBITAT | 2,883.8 | 3,481.4 | 2,245.0 | 5,097.0 | 4,384.7 | 5,489.4 | 6,436.9 | 7,548.0 | 8,851.0 | 10,378.8 |
| Depreciation | ||||||||||
| Changes in Account Receivables | ||||||||||
| Changes in Inventories | ||||||||||
| Changes in Accounts Payable | ||||||||||
| Capital Expenditure | ||||||||||
| UFCF | 5,723.1 | -173.7 | 1,537.6 | 9,920.5 | 2,562.9 | 4,377.1 | 6,161.9 | 7,225.6 | 8,472.8 | 9,935.4 |
| WACC, % | 8.3 | 8.29 | 8.29 | 8.29 | 8.29 | 8.29 | 8.29 | 8.29 | 8.29 | 8.29 |
| PV UFCF | ||||||||||
| SUM PV UFCF | 27,817.1 | |||||||||
| Long Term Growth Rate, % | 3.50 | |||||||||
| Free cash flow (T + 1) | 10,283 | |||||||||
| Terminal Value | 214,540 | |||||||||
| Present Terminal Value | 144,047 | |||||||||
| Enterprise Value | 171,865 | |||||||||
| Net Debt | -9,688 | |||||||||
| Equity Value | 181,553 | |||||||||
| Diluted Shares Outstanding, MM | 1,144 | |||||||||
| Equity Value Per Share | 158.68 |
ماذا ستتلقى
- DICARITE 688036SS FINALLES: الوصول إلى كل من البيانات التاريخية والمتوقعة للتقييم الدقيق.
- المعلمات القابلة للتخصيص: اضبط WACC ، ومعدلات الضرائب ، ونمو الإيرادات ، والنفقات الرأسمالية لتناسب تحليلك.
- الحسابات الآلية: الحساب الديناميكي للقيمة الجوهرية و NPV.
- تقييم السيناريو: استكشف السيناريوهات المختلفة لتقييم الأداء المستقبلي لـ Shenzhen Transsion Holdings.
- واجهة سهلة الاستخدام: تم تصميمه للمحترفين ، ولكن من السهل التنقل للقادمين الجدد.
الميزات الرئيسية
- 🔍 الحياة الحقيقية [688036SS] البيانات المالية: البيانات التاريخية والمتوقعة المليئة مسبقًا لشركة Shenzhen Transsion Holdings Co. ، Ltd.
- ✏️ مدخلات قابلة للتخصيص بالكامل: تعديل جميع المعلمات الأساسية (الخلايا الصفراء) مثل WACC و Growth ٪ ومعدلات الضرائب.
- 📊 تقييم DCF المهني: الصيغ المتكاملة تحسب القيمة الجوهرية لنقل Shenzhen باستخدام طريقة التدفق النقدي المخفض.
- ⚡ النتائج الفورية: انظر تقييم Shenzhen Transsion مباشرة بعد التعديلات.
- تحليل السيناريو: تقييم ومقارنة النتائج للافتراضات المالية المختلفة جنبًا إلى جنب.
كيف تعمل
- قم بتنزيل القالب: الحصول على وصول فوري إلى حاسبة Transsion Holdings المستندة إلى Excel لـ [688036SS].
- أدخل افتراضاتك: تعديل الخلايا ذات الضوء الصفراء لتحديد معدلات النمو الخاصة بك ، و WACC ، وهامش الربح ، والمتغيرات الأخرى.
- الحسابات الفورية: سيقوم النموذج تلقائيًا بإعادة حساب القيمة الجوهرية للممتلكات الشنتشن.
- سيناريوهات الاختبار: تجربة مع مختلف الافتراضات لمعرفة كيف يمكن أن تتغير نتائج التقييم.
- تحليل وتحديد: استفد من النتائج لإبلاغ اختياراتك الاستثمارية أو التقييمات المالية.
لماذا تختار شركة Shenzhen Transsion Holdings Co. ، Ltd. (688036SS)؟
- كفاءة الوقت: تخطي متاعب بناء نموذج مالي من الألف إلى الياء - مواردنا جاهزة للذهاب.
- الدقة المعززة: الأفكار المالية والعمليات الحسابية التي يمكن الاعتماد عليها تقلل من أخطاء التقييم.
- قابلة للتخصيص تماما: تكييف النموذج للتوافق مع افتراضاتك والتوقعات المحددة.
- سهل الاستخدام: المخططات والمخرجات البديهية تبسيط تحليل النتائج.
- أيد من قبل المهنيين: تم تصميمه للخبراء الذين يعطون الأولوية لكل من الدقة وسهولة الاستخدام.
من يمكنه الاستفادة من هذا المنتج؟
- طلاب التمويل: فهم أساليب التقييم والممارسة مع البيانات الحقيقية المتعلقة بـ Shenzhen Transsion Holdings Co. ، Ltd. (688036SS).
- الباحثون: دمج النماذج المالية المعمول بها في دراستك الأكاديمية أو مشاريع البحث.
- المستثمرون: التحقق من صحة نظريات الاستثمار الخاصة بك وتقييم مقاييس التقييم لشركة Shenzhen Transsion Holdings Co. ، Ltd. (688036SS).
- المحللون الماليون: تعزيز عملية التحليل الخاصة بك باستخدام نموذج DCF قابل للتخصيص مصمم خصيصًا لشينتشن Transsion Holdings Co. ، Ltd. (688036SS).
- رواد الأعمال: اكتشف كيف يتم التعامل مع التقييم للكيانات العامة الكبرى مثل شركة Shenzhen Transsion Holdings Co. ، Ltd. (688036SS).
محتويات القالب
- البيانات التاريخية: يتميز الأداء المالي السابق والتوقعات الأساسية لشركة Shenzhen Transsion Holdings Co. ، Ltd. (688036SS).
- نماذج DCF و Ruvered DCF: قوالب شاملة لحساب القيمة الجوهرية لشركة Shenzhen Transsion Holdings Co. ، Ltd. (688036SS).
- ورقة WACC: الحسابات التي تم بناؤها مسبقًا لمتوسط تكلفة رأس المال المرجح.
- مدخلات قابلة للتحرير: اضبط برامج التشغيل الرئيسية مثل معدلات النمو ونسب EBITDA وافتراضات Capex.
- البيانات الفصلية والسنوية: تحليل شامل للبيانات المالية لشركة Shenzhen Transsion Holdings Co. ، Ltd. (688036SS).
- لوحة القيادة التفاعلية: تصور ديناميكيا نتائج التقييم والتوقعات المستقبلية.
Disclaimer
All information, articles, and product details provided on this website are for general informational and educational purposes only. We do not claim any ownership over, nor do we intend to infringe upon, any trademarks, copyrights, logos, brand names, or other intellectual property mentioned or depicted on this site. Such intellectual property remains the property of its respective owners, and any references here are made solely for identification or informational purposes, without implying any affiliation, endorsement, or partnership.
We make no representations or warranties, express or implied, regarding the accuracy, completeness, or suitability of any content or products presented. Nothing on this website should be construed as legal, tax, investment, financial, medical, or other professional advice. In addition, no part of this site—including articles or product references—constitutes a solicitation, recommendation, endorsement, advertisement, or offer to buy or sell any securities, franchises, or other financial instruments, particularly in jurisdictions where such activity would be unlawful.
All content is of a general nature and may not address the specific circumstances of any individual or entity. It is not a substitute for professional advice or services. Any actions you take based on the information provided here are strictly at your own risk. You accept full responsibility for any decisions or outcomes arising from your use of this website and agree to release us from any liability in connection with your use of, or reliance upon, the content or products found herein.