
|
Shenzhen Transsion Holdings Co., Ltd. (688036.SS) DCF -Bewertung |
Fully Editable: Tailor To Your Needs In Excel Or Sheets
Professional Design: Trusted, Industry-Standard Templates
Investor-Approved Valuation Models
MAC/PC Compatible, Fully Unlocked
No Expertise Is Needed; Easy To Follow
Shenzhen Transsion Holdings Co., Ltd. (688036.SS) Bundle
Gewinnen Sie Einblicke in Ihre Shenzhen Transsion Holdings Co., Ltd. (688036SS) Bewertungsanalyse mit unserem ausgeklügelten DCF -Taschenrechner! Diese Excel -Vorlage wird mit authentischen (688036S) Daten vorinstalliert, sodass Sie die Vorhersagen und Annahmen für eine genaue Berechnung des intrinsischen Wertes von Shenzhen Transsion Holdings anpassen können.
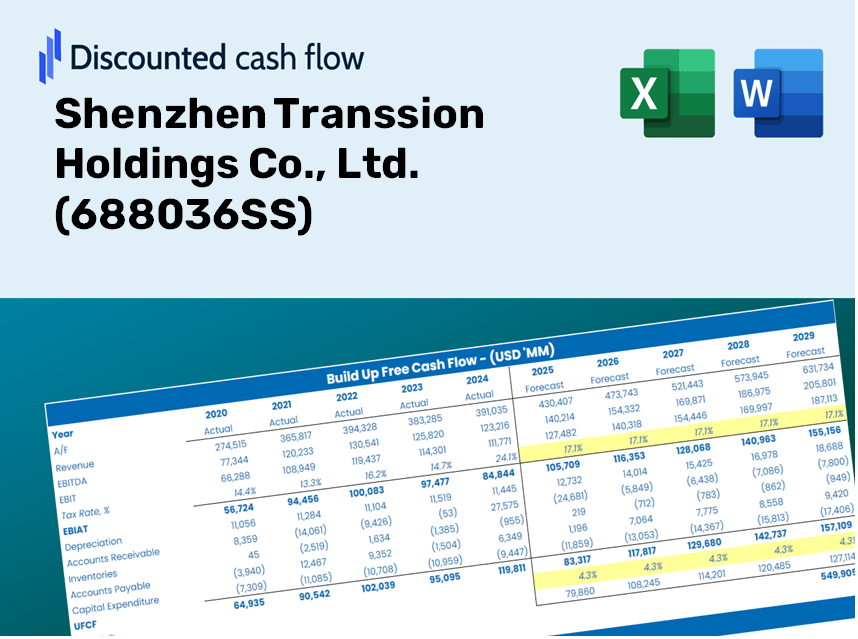
Discounted Cash Flow (DCF) - (USD MM)
| Year | AY1 2020 |
AY2 2021 |
AY3 2022 |
AY4 2023 |
AY5 2024 |
FY1 2025 |
FY2 2026 |
FY3 2027 |
FY4 2028 |
FY5 2029 |
|---|---|---|---|---|---|---|---|---|---|---|
| Revenue | 37,791.9 | 49,411.9 | 46,595.9 | 62,294.9 | 68,715.3 | 80,576.7 | 94,485.5 | 110,795.3 | 129,920.3 | 152,346.7 |
| Revenue Growth, % | 0 | 30.75 | -5.7 | 33.69 | 10.31 | 17.26 | 17.26 | 17.26 | 17.26 | 17.26 |
| EBITDA | 3,562.5 | 4,381.2 | 2,854.6 | 6,392.6 | 5,549.5 | 6,890.5 | 8,079.9 | 9,474.6 | 11,110.1 | 13,027.9 |
| EBITDA, % | 9.43 | 8.87 | 6.13 | 10.26 | 8.08 | 8.55 | 8.55 | 8.55 | 8.55 | 8.55 |
| Depreciation | 126.3 | 126.3 | 148.8 | 211.8 | 272.9 | 265.3 | 311.1 | 364.8 | 427.7 | 501.6 |
| Depreciation, % | 0.33413 | 0.25556 | 0.31944 | 0.33993 | 0.39711 | 0.32923 | 0.32923 | 0.32923 | 0.32923 | 0.32923 |
| EBIT | 3,436.3 | 4,254.9 | 2,705.7 | 6,180.8 | 5,276.6 | 6,625.2 | 7,768.8 | 9,109.9 | 10,682.4 | 12,526.3 |
| EBIT, % | 9.09 | 8.61 | 5.81 | 9.92 | 7.68 | 8.22 | 8.22 | 8.22 | 8.22 | 8.22 |
| Total Cash | 14,614.8 | 16,391.0 | 16,837.2 | 26,117.5 | 24,815.3 | 29,977.3 | 35,151.9 | 41,219.6 | 48,334.8 | 56,678.2 |
| Total Cash, percent | .0 | .0 | .0 | .0 | .0 | .0 | .0 | .0 | .0 | .0 |
| Account Receivables | 1,963.7 | 1,230.3 | 1,885.3 | 2,866.3 | 4,595.2 | 3,709.8 | 4,350.2 | 5,101.1 | 5,981.7 | 7,014.2 |
| Account Receivables, % | 5.2 | 2.49 | 4.05 | 4.6 | 6.69 | 4.6 | 4.6 | 4.6 | 4.6 | 4.6 |
| Inventories | 5,551.9 | 7,578.8 | 6,083.9 | 10,443.4 | 8,663.4 | 11,676.8 | 13,692.4 | 16,055.9 | 18,827.4 | 22,077.3 |
| Inventories, % | 14.69 | 15.34 | 13.06 | 16.76 | 12.61 | 14.49 | 14.49 | 14.49 | 14.49 | 14.49 |
| Accounts Payable | 10,547.6 | 8,799.8 | 7,943.8 | 18,718.6 | 17,212.9 | 18,994.4 | 22,273.1 | 26,117.8 | 30,626.2 | 35,912.7 |
| Accounts Payable, % | 27.91 | 17.81 | 17.05 | 30.05 | 25.05 | 23.57 | 23.57 | 23.57 | 23.57 | 23.57 |
| Capital Expenditure | -319.0 | -740.2 | -840.1 | -822.6 | -640.2 | -1,030.9 | -1,208.8 | -1,417.5 | -1,662.2 | -1,949.1 |
| Capital Expenditure, % | -0.84398 | -1.5 | -1.8 | -1.32 | -0.93166 | -1.28 | -1.28 | -1.28 | -1.28 | -1.28 |
| Tax Rate, % | 16.9 | 16.9 | 16.9 | 16.9 | 16.9 | 16.9 | 16.9 | 16.9 | 16.9 | 16.9 |
| EBITAT | 2,883.8 | 3,481.4 | 2,245.0 | 5,097.0 | 4,384.7 | 5,489.4 | 6,436.9 | 7,548.0 | 8,851.0 | 10,378.8 |
| Depreciation | ||||||||||
| Changes in Account Receivables | ||||||||||
| Changes in Inventories | ||||||||||
| Changes in Accounts Payable | ||||||||||
| Capital Expenditure | ||||||||||
| UFCF | 5,723.1 | -173.7 | 1,537.6 | 9,920.5 | 2,562.9 | 4,377.1 | 6,161.9 | 7,225.6 | 8,472.8 | 9,935.4 |
| WACC, % | 8.3 | 8.29 | 8.29 | 8.29 | 8.29 | 8.29 | 8.29 | 8.29 | 8.29 | 8.29 |
| PV UFCF | ||||||||||
| SUM PV UFCF | 27,817.1 | |||||||||
| Long Term Growth Rate, % | 3.50 | |||||||||
| Free cash flow (T + 1) | 10,283 | |||||||||
| Terminal Value | 214,540 | |||||||||
| Present Terminal Value | 144,047 | |||||||||
| Enterprise Value | 171,865 | |||||||||
| Net Debt | -9,688 | |||||||||
| Equity Value | 181,553 | |||||||||
| Diluted Shares Outstanding, MM | 1,144 | |||||||||
| Equity Value Per Share | 158.68 |
What You Will Receive
- Accurate 688036SS Financials: Access to both historical and projected data for precise valuation.
- Customizable Parameters: Adjust WACC, tax rates, revenue growth, and capital expenditures to fit your analysis.
- Automated Calculations: Dynamic computation of intrinsic value and NPV.
- Scenario Evaluation: Explore various scenarios to assess Shenzhen Transsion Holdings' future performance.
- User-Friendly Interface: Designed for professionals, yet easy to navigate for newcomers.
Key Features
- 🔍 Real-Life [688036SS] Financials: Pre-filled historical and projected data for Shenzhen Transsion Holdings Co., Ltd.
- ✏️ Fully Customizable Inputs: Modify all essential parameters (yellow cells) such as WACC, growth %, and tax rates.
- 📊 Professional DCF Valuation: Integrated formulas compute the intrinsic value of Shenzhen Transsion using the Discounted Cash Flow method.
- ⚡ Instant Results: See Shenzhen Transsion's valuation immediately after adjustments.
- Scenario Analysis: Evaluate and compare results for different financial assumptions side-by-side.
How It Functions
- Download the Template: Gain immediate access to the Excel-based Transsion Holdings DCF Calculator for [688036SS].
- Input Your Assumptions: Modify the yellow-highlighted cells to set your growth rates, WACC, profit margins, and other variables.
- Instant Calculations: The model will automatically recalculate the intrinsic value of Shenzhen Transsion Holdings.
- Test Scenarios: Experiment with various assumptions to see how valuation outcomes may change.
- Analyze and Decide: Leverage the results to inform your investment choices or financial assessments.
Why Select Shenzhen Transsion Holdings Co., Ltd. (688036SS)?
- Time Efficient: Skip the hassle of building a financial model from the ground up – our resources are ready to go.
- Enhanced Accuracy: Dependable financial insights and calculations minimize valuation errors.
- Completely Customizable: Adapt the model to align with your specific assumptions and forecasts.
- User-Friendly: Intuitive charts and outputs simplify the analysis of results.
- Endorsed by Professionals: Crafted for experts who prioritize both accuracy and ease of use.
Who Can Benefit from This Product?
- Finance Students: Understand valuation methods and practice with real data related to Shenzhen Transsion Holdings Co., Ltd. (688036SS).
- Researchers: Integrate established financial models into your academic studies or research projects.
- Investors: Validate your investment theories and evaluate the valuation metrics for Shenzhen Transsion Holdings Co., Ltd. (688036SS).
- Financial Analysts: Enhance your analysis process with a customizable DCF model tailored for Shenzhen Transsion Holdings Co., Ltd. (688036SS).
- Entrepreneurs: Discover how valuation is approached for major public entities like Shenzhen Transsion Holdings Co., Ltd. (688036SS).
Contents of the Template
- Historical Data: Features past financial performance and baseline forecasts for Shenzhen Transsion Holdings Co., Ltd. (688036SS).
- DCF and Levered DCF Models: Comprehensive templates for calculating the intrinsic value of Shenzhen Transsion Holdings Co., Ltd. (688036SS).
- WACC Sheet: Pre-constructed calculations for the Weighted Average Cost of Capital.
- Editable Inputs: Adjust key drivers such as growth rates, EBITDA percentages, and CAPEX assumptions.
- Quarterly and Annual Statements: A thorough analysis of the financials for Shenzhen Transsion Holdings Co., Ltd. (688036SS).
- Interactive Dashboard: Dynamically visualize the valuation results and future projections.
Disclaimer
All information, articles, and product details provided on this website are for general informational and educational purposes only. We do not claim any ownership over, nor do we intend to infringe upon, any trademarks, copyrights, logos, brand names, or other intellectual property mentioned or depicted on this site. Such intellectual property remains the property of its respective owners, and any references here are made solely for identification or informational purposes, without implying any affiliation, endorsement, or partnership.
We make no representations or warranties, express or implied, regarding the accuracy, completeness, or suitability of any content or products presented. Nothing on this website should be construed as legal, tax, investment, financial, medical, or other professional advice. In addition, no part of this site—including articles or product references—constitutes a solicitation, recommendation, endorsement, advertisement, or offer to buy or sell any securities, franchises, or other financial instruments, particularly in jurisdictions where such activity would be unlawful.
All content is of a general nature and may not address the specific circumstances of any individual or entity. It is not a substitute for professional advice or services. Any actions you take based on the information provided here are strictly at your own risk. You accept full responsibility for any decisions or outcomes arising from your use of this website and agree to release us from any liability in connection with your use of, or reliance upon, the content or products found herein.