
|
Bandai Namco Holdings Inc. (7832.t) DCF تقييم |
Fully Editable: Tailor To Your Needs In Excel Or Sheets
Professional Design: Trusted, Industry-Standard Templates
Investor-Approved Valuation Models
MAC/PC Compatible, Fully Unlocked
No Expertise Is Needed; Easy To Follow
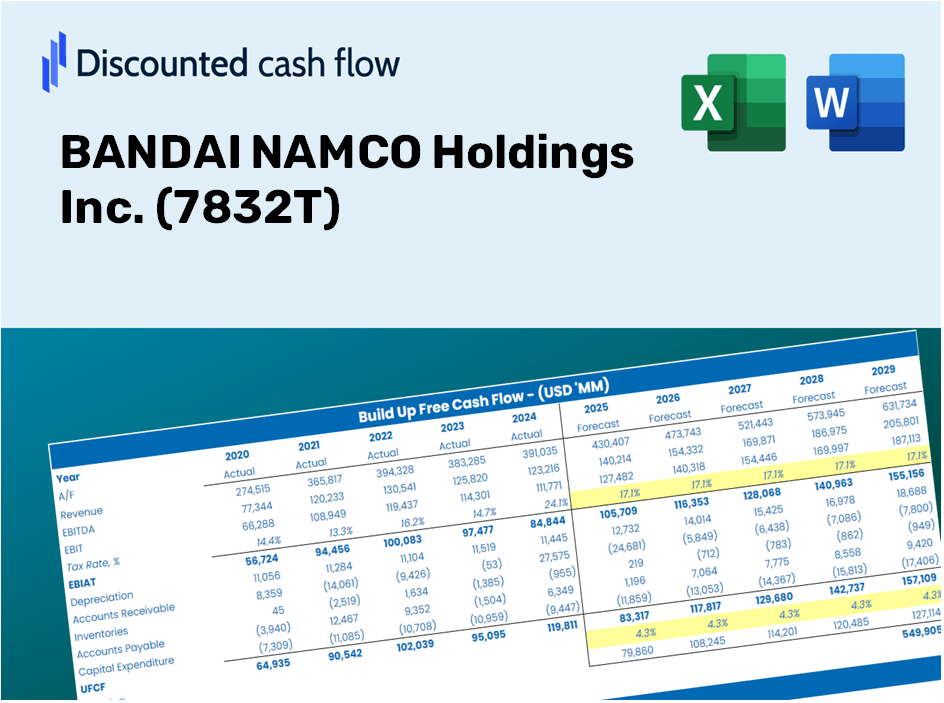
BANDAI NAMCO Holdings Inc. (7832.T) Bundle
تبحث لتقييم القيمة الجوهرية لشركة Bandai Namco Holdings Inc.؟ يدمج حاسبة DCF (7832T) DCF بيانات العالم الحقيقي مع ميزات تخصيص شاملة ، مما يتيح لك تكييف التنبؤات وتعزيز خيارات الاستثمار الخاصة بك.
Discounted Cash Flow (DCF) - (USD MM)
| Year | AY1 2021 |
AY2 2022 |
AY3 2023 |
AY4 2024 |
AY5 2025 |
FY1 2026 |
FY2 2027 |
FY3 2028 |
FY4 2029 |
FY5 2030 |
|---|---|---|---|---|---|---|---|---|---|---|
| Revenue | 740,903.0 | 889,270.0 | 990,089.0 | 1,050,210.0 | 1,241,513.0 | 1,414,239.8 | 1,610,997.3 | 1,835,129.0 | 2,090,443.1 | 2,381,278.2 |
| Revenue Growth, % | 0 | 20.03 | 11.34 | 6.07 | 18.22 | 13.91 | 13.91 | 13.91 | 13.91 | 13.91 |
| EBITDA | 99,162.0 | 159,203.0 | 157,649.0 | 187,990.0 | 227,347.0 | 235,956.4 | 268,784.0 | 306,178.9 | 348,776.4 | 397,300.2 |
| EBITDA, % | 13.38 | 17.9 | 15.92 | 17.9 | 18.31 | 16.68 | 16.68 | 16.68 | 16.68 | 16.68 |
| Depreciation | 26,993.0 | 27,944.0 | 31,102.0 | 41,040.0 | 42,834.0 | 48,889.9 | 55,691.8 | 63,440.0 | 72,266.1 | 82,320.2 |
| Depreciation, % | 3.64 | 3.14 | 3.14 | 3.91 | 3.45 | 3.46 | 3.46 | 3.46 | 3.46 | 3.46 |
| EBIT | 72,169.0 | 131,259.0 | 126,547.0 | 146,950.0 | 184,513.0 | 187,066.5 | 213,092.3 | 242,738.9 | 276,510.2 | 314,980.0 |
| EBIT, % | 9.74 | 14.76 | 12.78 | 13.99 | 14.86 | 13.23 | 13.23 | 13.23 | 13.23 | 13.23 |
| Total Cash | 204,326.0 | 279,401.0 | 280,226.0 | 321,868.0 | 388,460.0 | 422,115.0 | 480,842.2 | 547,739.9 | 623,944.7 | 710,751.7 |
| Total Cash, percent | .0 | .0 | .0 | .0 | .0 | .0 | .0 | .0 | .0 | .0 |
| Account Receivables | 90,126.0 | 120,741.0 | 97,921.0 | 117,115.0 | 123,998.0 | 160,576.3 | 182,916.6 | 208,365.1 | 237,354.1 | 270,376.2 |
| Account Receivables, % | 12.16 | 13.58 | 9.89 | 11.15 | 9.99 | 11.35 | 11.35 | 11.35 | 11.35 | 11.35 |
| Inventories | 106,885.0 | 124,248.0 | 152,222.0 | 140,596.0 | 128,710.0 | 190,999.9 | 217,572.9 | 247,843.0 | 282,324.4 | 321,603.1 |
| Inventories, % | 14.43 | 13.97 | 15.37 | 13.39 | 10.37 | 13.51 | 13.51 | 13.51 | 13.51 | 13.51 |
| Accounts Payable | 82,474.0 | 99,810.0 | 99,244.0 | 99,254.0 | 98,068.0 | 140,657.6 | 160,226.7 | 182,518.5 | 207,911.5 | 236,837.4 |
| Accounts Payable, % | 11.13 | 11.22 | 10.02 | 9.45 | 7.9 | 9.95 | 9.95 | 9.95 | 9.95 | 9.95 |
| Capital Expenditure | -23,848.0 | -26,797.0 | -33,807.0 | -34,909.0 | -42,436.0 | -46,355.3 | -52,804.5 | -60,151.0 | -68,519.6 | -78,052.5 |
| Capital Expenditure, % | -3.22 | -3.01 | -3.41 | -3.32 | -3.42 | -3.28 | -3.28 | -3.28 | -3.28 | -3.28 |
| Tax Rate, % | 29.77 | 29.77 | 29.77 | 29.77 | 29.77 | 29.77 | 29.77 | 29.77 | 29.77 | 29.77 |
| EBITAT | 49,049.6 | 93,019.2 | 90,582.6 | 101,707.6 | 129,575.6 | 130,890.5 | 149,100.7 | 169,844.5 | 193,474.3 | 220,391.6 |
| Depreciation | ||||||||||
| Changes in Account Receivables | ||||||||||
| Changes in Inventories | ||||||||||
| Changes in Accounts Payable | ||||||||||
| Capital Expenditure | ||||||||||
| UFCF | -62,342.4 | 63,524.2 | 82,157.6 | 100,280.6 | 133,790.6 | 77,146.5 | 122,643.7 | 139,706.6 | 159,143.5 | 181,284.5 |
| WACC, % | 4.87 | 4.87 | 4.87 | 4.87 | 4.87 | 4.87 | 4.87 | 4.87 | 4.87 | 4.87 |
| PV UFCF | ||||||||||
| SUM PV UFCF | 580,768.2 | |||||||||
| Long Term Growth Rate, % | 2.00 | |||||||||
| Free cash flow (T + 1) | 184,910 | |||||||||
| Terminal Value | 6,449,280 | |||||||||
| Present Terminal Value | 5,085,270 | |||||||||
| Enterprise Value | 5,666,038 | |||||||||
| Net Debt | -388,460 | |||||||||
| Equity Value | 6,054,498 | |||||||||
| Diluted Shares Outstanding, MM | 653 | |||||||||
| Equity Value Per Share | 9,265.45 |
الفوائد التي ستتلقاها
- بيانات Bandai Namco الأصلية: الوصول إلى البيانات التاريخية والمتوقعة للتقييم الدقيق.
- مدخلات قابلة للتخصيص: اضبط WACC ومعدلات الضرائب ونمو الإيرادات والنفقات الرأسمالية حسب الحاجة.
- الحسابات الديناميكية: يتم تحديث القيمة الجوهرية و NPV تلقائيًا بناءً على مدخلاتك.
- اختبار السيناريو: استكشف السيناريوهات المختلفة لتقييم الأداء المستقبلي لـ Bandai Namco.
- تصميم سهل الاستخدام: تم تصميمه للمحترفين ، ولكن سهلة الاستخدام بما يكفي للوافدين الجدد.
الميزات الرئيسية
- البيانات التي تم تحميلها مسبقًا: البيانات المالية التاريخية ل Bandai Namco والتوقعات المليئة مسبقًا.
- مدخلات قابلة للتعديل بالكامل: تخصيص WACC ، ومعدلات الضرائب ، ونمو الإيرادات ، وهامش الأرباح قبل الفوائد والضرائب والإهلاك والاستهلاك.
- النتائج الفورية: عرض القيمة الجوهرية ل Bandai Namco في الوقت الفعلي.
- واضحة المخرجات المرئية: تعرض مخططات لوحة القيادة نتائج التقييم والمقاييس الأساسية.
- بنيت للدقة: أداة مهنية مصممة للمحللين والمستثمرين وخبراء التمويل.
كيف تعمل
- الخطوة 1: قم بتنزيل ملف Excel.
- الخطوة 2: فحص بيانات Bandai Namco المليئة مسبقًا (تاريخية ومتوقعة).
- الخطوة 3: تعديل الافتراضات الرئيسية (الخلايا الصفراء) وفقا لتحليلك.
- الخطوة 4: راقب عمليات إعادة حساب التلقائي لقيمة Bandai Namco الجوهرية.
- الخطوة 5: الاستفادة من مخرجات قرارات الاستثمار أو التقارير.
لماذا تختار حاسبة Bandai Namco المالية؟
- كفاءة الوقت: تخطي متاعب بناء نموذج DCF من الألف إلى الياء - إنه جاهز للاستخدام الفوري.
- الدقة المعززة: البيانات المالية التي يمكن الاعتماد عليها تقلل من أخطاء التقييم.
- قابلة للتخصيص تماما: اضبط النموذج للتوافق مع افتراضاتك والتوقعات المحددة.
- التصور البديهي: المخططات والمخرجات سهلة الاستخدام تجعل تحليل النتائج واضحًا.
- أيد من قبل المهنيين: صُنع للخبراء الذين يعطون الأولوية للدقة والوظائف.
من يمكنه الاستفادة من هذا المنتج؟
- المستثمرون الأفراد: اتخاذ قرارات مستنيرة بشأن شراء أو بيع Bandai Namco Holdings Inc. (7832T).
- المحللون الماليون: تعزيز منهجيات التقييم مع النماذج المالية المتاحة بسهولة مصممة خصيصًا لشركة Bandai Namco Holdings Inc. (7832T).
- الاستشاريون: تزويد العملاء برؤى تقييم دقيقة وفي الوقت المناسب على Bandai Namco Holdings Inc. (7832T).
- أصحاب الأعمال: احصل على فهم لكيفية قيمة الشركات الكبيرة مثل Bandai Namco Holdings Inc. (7832T) لإبلاغ قراراتك الاستراتيجية.
- طلاب التمويل: استكشاف تقنيات التقييم من خلال عدسة بيانات العالم الحقيقي ودراسات الحالة التي تشمل Bandai Namco Holdings Inc. (7832T).
ما يتضمنه القالب
- البيانات التاريخية: يحتوي على الأداء المالي السابق لشركة Bandai Namco Holdings Inc.
- نماذج DCF و Ruvered DCF: قوالب شاملة لتحديد القيمة الجوهرية لشركة Bandai Namco Holdings Inc.
- ورقة WACC: حسابات جاهزة للاستخدام لمتوسط تكلفة رأس المال المرجح.
- مدخلات قابلة للتحرير: تخصيص برامج التشغيل الحاسمة مثل معدلات النمو ونسب EBITDA وافتراضات Capex.
- البيانات الفصلية والسنوية: تحليل واسع النطاق لبيانات Bandai Namco Holdings Inc.
- لوحة القيادة التفاعلية: تصور ديناميكيا نتائج التقييم والتوقعات.
Disclaimer
All information, articles, and product details provided on this website are for general informational and educational purposes only. We do not claim any ownership over, nor do we intend to infringe upon, any trademarks, copyrights, logos, brand names, or other intellectual property mentioned or depicted on this site. Such intellectual property remains the property of its respective owners, and any references here are made solely for identification or informational purposes, without implying any affiliation, endorsement, or partnership.
We make no representations or warranties, express or implied, regarding the accuracy, completeness, or suitability of any content or products presented. Nothing on this website should be construed as legal, tax, investment, financial, medical, or other professional advice. In addition, no part of this site—including articles or product references—constitutes a solicitation, recommendation, endorsement, advertisement, or offer to buy or sell any securities, franchises, or other financial instruments, particularly in jurisdictions where such activity would be unlawful.
All content is of a general nature and may not address the specific circumstances of any individual or entity. It is not a substitute for professional advice or services. Any actions you take based on the information provided here are strictly at your own risk. You accept full responsibility for any decisions or outcomes arising from your use of this website and agree to release us from any liability in connection with your use of, or reliance upon, the content or products found herein.