
|
BANDAI NAMCO Holdings Inc. (7832.T) DCF Valuation |
Fully Editable: Tailor To Your Needs In Excel Or Sheets
Professional Design: Trusted, Industry-Standard Templates
Investor-Approved Valuation Models
MAC/PC Compatible, Fully Unlocked
No Expertise Is Needed; Easy To Follow
BANDAI NAMCO Holdings Inc. (7832.T) Bundle
Looking to assess the intrinsic value of BANDAI NAMCO Holdings Inc.? Our (7832T) DCF Calculator integrates real-world data with comprehensive customization features, allowing you to tailor forecasts and enhance your investment choices.
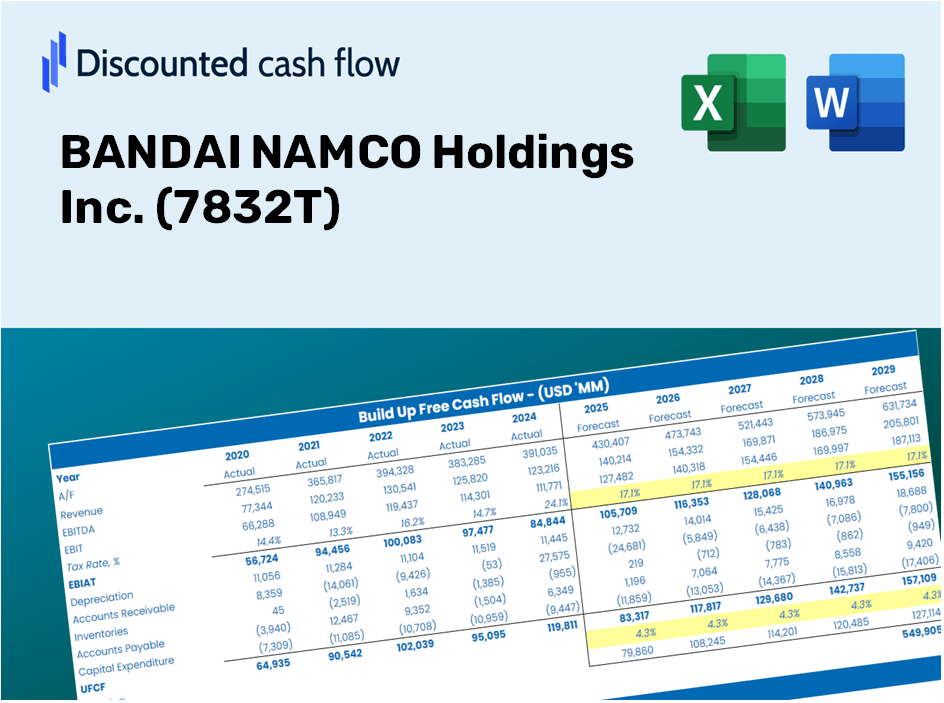
Discounted Cash Flow (DCF) - (USD MM)
| Year | AY1 2021 |
AY2 2022 |
AY3 2023 |
AY4 2024 |
AY5 2025 |
FY1 2026 |
FY2 2027 |
FY3 2028 |
FY4 2029 |
FY5 2030 |
|---|---|---|---|---|---|---|---|---|---|---|
| Revenue | 740,903.0 | 889,270.0 | 990,089.0 | 1,050,210.0 | 1,241,513.0 | 1,414,239.8 | 1,610,997.3 | 1,835,129.0 | 2,090,443.1 | 2,381,278.2 |
| Revenue Growth, % | 0 | 20.03 | 11.34 | 6.07 | 18.22 | 13.91 | 13.91 | 13.91 | 13.91 | 13.91 |
| EBITDA | 99,162.0 | 159,203.0 | 157,649.0 | 187,990.0 | 227,347.0 | 235,956.4 | 268,784.0 | 306,178.9 | 348,776.4 | 397,300.2 |
| EBITDA, % | 13.38 | 17.9 | 15.92 | 17.9 | 18.31 | 16.68 | 16.68 | 16.68 | 16.68 | 16.68 |
| Depreciation | 26,993.0 | 27,944.0 | 31,102.0 | 41,040.0 | 42,834.0 | 48,889.9 | 55,691.8 | 63,440.0 | 72,266.1 | 82,320.2 |
| Depreciation, % | 3.64 | 3.14 | 3.14 | 3.91 | 3.45 | 3.46 | 3.46 | 3.46 | 3.46 | 3.46 |
| EBIT | 72,169.0 | 131,259.0 | 126,547.0 | 146,950.0 | 184,513.0 | 187,066.5 | 213,092.3 | 242,738.9 | 276,510.2 | 314,980.0 |
| EBIT, % | 9.74 | 14.76 | 12.78 | 13.99 | 14.86 | 13.23 | 13.23 | 13.23 | 13.23 | 13.23 |
| Total Cash | 204,326.0 | 279,401.0 | 280,226.0 | 321,868.0 | 388,460.0 | 422,115.0 | 480,842.2 | 547,739.9 | 623,944.7 | 710,751.7 |
| Total Cash, percent | .0 | .0 | .0 | .0 | .0 | .0 | .0 | .0 | .0 | .0 |
| Account Receivables | 90,126.0 | 120,741.0 | 97,921.0 | 117,115.0 | 123,998.0 | 160,576.3 | 182,916.6 | 208,365.1 | 237,354.1 | 270,376.2 |
| Account Receivables, % | 12.16 | 13.58 | 9.89 | 11.15 | 9.99 | 11.35 | 11.35 | 11.35 | 11.35 | 11.35 |
| Inventories | 106,885.0 | 124,248.0 | 152,222.0 | 140,596.0 | 128,710.0 | 190,999.9 | 217,572.9 | 247,843.0 | 282,324.4 | 321,603.1 |
| Inventories, % | 14.43 | 13.97 | 15.37 | 13.39 | 10.37 | 13.51 | 13.51 | 13.51 | 13.51 | 13.51 |
| Accounts Payable | 82,474.0 | 99,810.0 | 99,244.0 | 99,254.0 | 98,068.0 | 140,657.6 | 160,226.7 | 182,518.5 | 207,911.5 | 236,837.4 |
| Accounts Payable, % | 11.13 | 11.22 | 10.02 | 9.45 | 7.9 | 9.95 | 9.95 | 9.95 | 9.95 | 9.95 |
| Capital Expenditure | -23,848.0 | -26,797.0 | -33,807.0 | -34,909.0 | -42,436.0 | -46,355.3 | -52,804.5 | -60,151.0 | -68,519.6 | -78,052.5 |
| Capital Expenditure, % | -3.22 | -3.01 | -3.41 | -3.32 | -3.42 | -3.28 | -3.28 | -3.28 | -3.28 | -3.28 |
| Tax Rate, % | 29.77 | 29.77 | 29.77 | 29.77 | 29.77 | 29.77 | 29.77 | 29.77 | 29.77 | 29.77 |
| EBITAT | 49,049.6 | 93,019.2 | 90,582.6 | 101,707.6 | 129,575.6 | 130,890.5 | 149,100.7 | 169,844.5 | 193,474.3 | 220,391.6 |
| Depreciation | ||||||||||
| Changes in Account Receivables | ||||||||||
| Changes in Inventories | ||||||||||
| Changes in Accounts Payable | ||||||||||
| Capital Expenditure | ||||||||||
| UFCF | -62,342.4 | 63,524.2 | 82,157.6 | 100,280.6 | 133,790.6 | 77,146.5 | 122,643.7 | 139,706.6 | 159,143.5 | 181,284.5 |
| WACC, % | 4.91 | 4.91 | 4.91 | 4.91 | 4.91 | 4.91 | 4.91 | 4.91 | 4.91 | 4.91 |
| PV UFCF | ||||||||||
| SUM PV UFCF | 579,979.6 | |||||||||
| Long Term Growth Rate, % | 2.00 | |||||||||
| Free cash flow (T + 1) | 184,910 | |||||||||
| Terminal Value | 6,352,803 | |||||||||
| Present Terminal Value | 4,998,811 | |||||||||
| Enterprise Value | 5,578,791 | |||||||||
| Net Debt | -388,460 | |||||||||
| Equity Value | 5,967,251 | |||||||||
| Diluted Shares Outstanding, MM | 653 | |||||||||
| Equity Value Per Share | 9,131.93 |
Benefits You Will Receive
- Authentic BANDAI NAMCO Financials: Access to historical and projected data for precise valuation.
- Customizable Inputs: Adjust WACC, tax rates, revenue growth, and capital expenditures as needed.
- Dynamic Calculations: Intrinsic value and NPV are automatically updated based on your inputs.
- Scenario Testing: Explore various scenarios to assess the future performance of BANDAI NAMCO.
- User-Friendly Design: Designed for professionals, yet user-friendly enough for newcomers.
Key Features
- Pre-Loaded Data: BANDAI NAMCO's historical financial statements and pre-filled forecasts.
- Fully Adjustable Inputs: Customize WACC, tax rates, revenue growth, and EBITDA margins.
- Instant Results: View BANDAI NAMCO's intrinsic value recalculated in real time.
- Clear Visual Outputs: Dashboard charts showcase valuation results and essential metrics.
- Built for Accuracy: A professional tool designed for analysts, investors, and finance experts.
How It Works
- Step 1: Download the Excel file.
- Step 2: Examine the pre-filled BANDAI NAMCO data (historical and projected).
- Step 3: Modify key assumptions (yellow cells) according to your analysis.
- Step 4: Observe automatic recalculations for BANDAI NAMCO's intrinsic value.
- Step 5: Leverage the outputs for investment decisions or reporting.
Why Opt for BANDAI NAMCO's Financial Calculator?
- Time Efficient: Skip the hassle of building a DCF model from the ground up – it’s ready for immediate use.
- Enhanced Precision: Dependable financial data and formulas minimize valuation errors.
- Completely Customizable: Adjust the model to align with your specific assumptions and forecasts.
- Intuitive Visualization: User-friendly charts and outputs make result analysis straightforward.
- Endorsed by Professionals: Crafted for experts who prioritize accuracy and functionality.
Who Can Benefit from This Product?
- Individual Investors: Make informed decisions regarding buying or selling BANDAI NAMCO Holdings Inc. (7832T) stock.
- Financial Analysts: Enhance valuation methodologies with readily available financial models tailored to BANDAI NAMCO Holdings Inc. (7832T).
- Consultants: Provide clients with accurate and timely valuation insights on BANDAI NAMCO Holdings Inc. (7832T).
- Business Owners: Gain an understanding of how large corporations like BANDAI NAMCO Holdings Inc. (7832T) are valued to inform your strategic decisions.
- Finance Students: Explore valuation techniques through the lens of real-world data and case studies involving BANDAI NAMCO Holdings Inc. (7832T).
What the Template Includes
- Historical Data: Contains BANDAI NAMCO Holdings Inc.’s past financial performance and foundational forecasts.
- DCF and Levered DCF Models: Comprehensive templates to determine BANDAI NAMCO Holdings Inc.’s intrinsic value.
- WACC Sheet: Ready-to-use calculations for the Weighted Average Cost of Capital.
- Editable Inputs: Customize crucial drivers such as growth rates, EBITDA percentages, and CAPEX assumptions.
- Quarterly and Annual Statements: An extensive analysis of BANDAI NAMCO Holdings Inc.’s financials.
- Interactive Dashboard: Dynamically visualize valuation outcomes and forecasts.
Disclaimer
All information, articles, and product details provided on this website are for general informational and educational purposes only. We do not claim any ownership over, nor do we intend to infringe upon, any trademarks, copyrights, logos, brand names, or other intellectual property mentioned or depicted on this site. Such intellectual property remains the property of its respective owners, and any references here are made solely for identification or informational purposes, without implying any affiliation, endorsement, or partnership.
We make no representations or warranties, express or implied, regarding the accuracy, completeness, or suitability of any content or products presented. Nothing on this website should be construed as legal, tax, investment, financial, medical, or other professional advice. In addition, no part of this site—including articles or product references—constitutes a solicitation, recommendation, endorsement, advertisement, or offer to buy or sell any securities, franchises, or other financial instruments, particularly in jurisdictions where such activity would be unlawful.
All content is of a general nature and may not address the specific circumstances of any individual or entity. It is not a substitute for professional advice or services. Any actions you take based on the information provided here are strictly at your own risk. You accept full responsibility for any decisions or outcomes arising from your use of this website and agree to release us from any liability in connection with your use of, or reliance upon, the content or products found herein.