
|
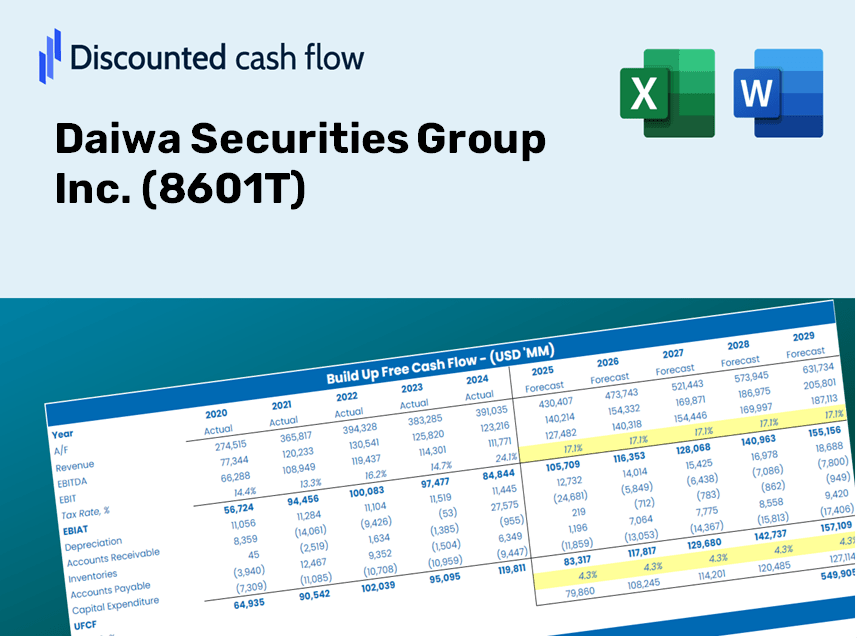
Daiwa Securities Group Inc. (8601.T) تقييم DCF |
Fully Editable: Tailor To Your Needs In Excel Or Sheets
Professional Design: Trusted, Industry-Standard Templates
Investor-Approved Valuation Models
MAC/PC Compatible, Fully Unlocked
No Expertise Is Needed; Easy To Follow
Daiwa Securities Group Inc. (8601.T) Bundle
تبحث لتحديد القيمة الجوهرية لمجموعة Daiwa Securities Group Inc.؟ يدمج حاسبة DCF (8601T) DCF بيانات العالم الحقيقي مع ميزات تخصيص واسعة ، مما يتيح لك ضبط التوقعات وتعزيز خيارات الاستثمار الخاصة بك.
Discounted Cash Flow (DCF) - (USD MM)
| Year | AY1 2021 |
AY2 2022 |
AY3 2023 |
AY4 2024 |
AY5 2025 |
FY1 2026 |
FY2 2027 |
FY3 2028 |
FY4 2029 |
FY5 2030 |
|---|---|---|---|---|---|---|---|---|---|---|
| Revenue | 582,162.0 | 623,327.0 | 871,228.0 | 1,277,467.0 | 1,374,935.0 | 1,722,449.1 | 2,157,797.1 | 2,703,179.2 | 3,386,406.3 | 4,242,318.6 |
| Revenue Growth, % | 0 | 7.07 | 39.77 | 46.63 | 7.63 | 25.27 | 25.27 | 25.27 | 25.27 | 25.27 |
| EBITDA | 136,753.0 | 164,816.0 | 114,453.0 | 204,163.0 | 214,303.0 | 326,015.3 | 408,415.4 | 511,642.2 | 640,959.5 | 802,961.7 |
| EBITDA, % | 23.49 | 26.44 | 13.14 | 15.98 | 15.59 | 18.93 | 18.93 | 18.93 | 18.93 | 18.93 |
| Depreciation | 42,336.0 | 46,159.0 | 45,772.0 | 47,151.0 | 45,820.0 | 92,856.2 | 116,325.5 | 145,726.7 | 182,559.1 | 228,700.8 |
| Depreciation, % | 7.27 | 7.41 | 5.25 | 3.69 | 3.33 | 5.39 | 5.39 | 5.39 | 5.39 | 5.39 |
| EBIT | 94,417.0 | 118,657.0 | 68,681.0 | 157,012.0 | 168,483.0 | 233,159.1 | 292,089.9 | 365,915.5 | 458,400.4 | 574,260.8 |
| EBIT, % | 16.22 | 19.04 | 7.88 | 12.29 | 12.25 | 13.54 | 13.54 | 13.54 | 13.54 | 13.54 |
| Total Cash | 4,763,197.0 | 4,592,384.0 | 3,866,819.0 | 4,959,334.0 | 20,721,257.0 | 1,722,449.1 | 2,157,797.1 | 2,703,179.2 | 3,386,406.3 | 4,242,318.6 |
| Total Cash, percent | .0 | .0 | .0 | .0 | .0 | .0 | .0 | .0 | .0 | .0 |
| Account Receivables | 57,717.0 | .0 | 85,867.0 | 2,896,919.0 | 2,974,653.0 | 757,085.6 | 948,438.6 | 1,188,156.0 | 1,488,461.7 | 1,864,669.6 |
| Account Receivables, % | 9.91 | 0 | 9.86 | 226.77 | 216.35 | 43.95 | 43.95 | 43.95 | 43.95 | 43.95 |
| Inventories | 603.0 | 768.0 | 853.0 | 839.0 | .0 | 1,344.8 | 1,684.7 | 2,110.5 | 2,643.9 | 3,312.2 |
| Inventories, % | 0.10358 | 0.12321 | 0.09790778 | 0.06567684 | 0 | 0.07807477 | 0.07807477 | 0.07807477 | 0.07807477 | 0.07807477 |
| Accounts Payable | 5,382.0 | 6,361.0 | 8,120.0 | 8,507.0 | 8,471.0 | 14,327.4 | 17,948.7 | 22,485.2 | 28,168.3 | 35,287.8 |
| Accounts Payable, % | 0.92448 | 1.02 | 0.93202 | 0.66593 | 0.6161 | 0.8318 | 0.8318 | 0.8318 | 0.8318 | 0.8318 |
| Capital Expenditure | -58,600.0 | -85,587.0 | -81,248.0 | -64,495.0 | -46,823.0 | -143,226.5 | -179,427.0 | -224,777.0 | -281,589.3 | -352,760.8 |
| Capital Expenditure, % | -10.07 | -13.73 | -9.33 | -5.05 | -3.41 | -8.32 | -8.32 | -8.32 | -8.32 | -8.32 |
| Tax Rate, % | 29.52 | 29.52 | 29.52 | 29.52 | 29.52 | 29.52 | 29.52 | 29.52 | 29.52 | 29.52 |
| EBITAT | 70,793.6 | 79,479.1 | 45,336.2 | 106,034.6 | 118,745.6 | 161,338.5 | 202,116.8 | 253,201.7 | 317,198.2 | 397,369.9 |
| Depreciation | ||||||||||
| Changes in Account Receivables | ||||||||||
| Changes in Inventories | ||||||||||
| Changes in Accounts Payable | ||||||||||
| Capital Expenditure | ||||||||||
| UFCF | 1,591.6 | 98,582.1 | -74,332.8 | -2,721,960.4 | 40,811.6 | 2,333,047.1 | -49,056.3 | -61,455.3 | -76,988.1 | -96,446.7 |
| WACC, % | 7.74 | 7.07 | 6.99 | 7.11 | 7.36 | 7.25 | 7.25 | 7.25 | 7.25 | 7.25 |
| PV UFCF | ||||||||||
| SUM PV UFCF | 1,956,686.5 | |||||||||
| Long Term Growth Rate, % | 2.00 | |||||||||
| Free cash flow (T + 1) | -98,376 | |||||||||
| Terminal Value | -1,873,003 | |||||||||
| Present Terminal Value | -1,319,792 | |||||||||
| Enterprise Value | 636,894 | |||||||||
| Net Debt | -15,326,307 | |||||||||
| Equity Value | 15,963,201 | |||||||||
| Diluted Shares Outstanding, MM | 1,434 | |||||||||
| Equity Value Per Share | 11,131.45 |
ماذا ستتلقى
- بيانات 8601T المالية الأصيلة: الوصول إلى كل من البيانات التاريخية والمتوقعة للتقييم الدقيق.
- مدخلات قابلة للتخصيص: اضبط المعلمات مثل WACC ومعدلات الضرائب ونمو الإيرادات والاستثمارات الرأسمالية.
- الحسابات التلقائية: الحساب الديناميكي للقيمة الجوهرية و NPV.
- تحليل السيناريو: تقييم السيناريوهات المختلفة لتقييم الأداء المستقبلي لشركة Daiwa Securities Group Inc.
- تصميم سهل الاستخدام: شيدت للمهنيين مع بقاء متناول القادمين الجدد.
الميزات الرئيسية
- مدخلات التنبؤ القابلة للتخصيص: اضبط المتغيرات الأساسية مثل نمو الإيرادات ، والنسبة المئوية للوافق قبل الفوائد والضرائب والإهلاك والاستثمارات الرأسمالية.
- تقييم DCF الفوري: يحسب بسرعة القيمة الجوهرية ، NPV ، والمقاييس المالية الإضافية.
- دقة عالية الدقة: يستخدم البيانات المالية في العالم الحقيقي من Daiwa Securities Group Inc. (8601T) لنتائج تقييم يمكن الاعتماد عليها.
- تحليل سيناريو مبسط: تقييم دون عناء الافتراضات وتحليل نتائجها.
- داعم الكفاءة: تجنب تحديات بناء نماذج تقييم معقدة من الألف إلى الياء.
كيف تعمل
- الخطوة 1: قم بتنزيل ملف Excel.
- الخطوة 2: فحص البيانات المالية المملوءة مسبقًا وتوقعات Daiwa Securities Group Inc. (8601T).
- الخطوة 3: ضبط المدخلات الرئيسية مثل نمو الإيرادات ، WACC ، ومعدلات الضرائب (الخلايا المميزة).
- الخطوة 4: راقب تحديث نموذج DCF في الوقت الفعلي أثناء تعديل افتراضاتك.
- الخطوة 5: راجع المخرجات واستخدم النتائج الخاصة باستراتيجيات الاستثمار الخاصة بك.
لماذا تختار حاسبة Daiwa Securities؟
- دقة: يستخدم البيانات المالية DAIWA الأصلية لضمان الدقة.
- التنوع: تم تصميمه للمستخدمين لتجربة وضبط مدخلاتهم بسهولة.
- كفاءة: التخلص من الحاجة إلى إنشاء نموذج DCF من الألف إلى الياء.
- مستوى الخبراء: مصنوع من الرؤى والمعايير المتوقعة على مستوى المدير المالي.
- يمكن الوصول إليه: التصميم البديهي يجعلها سهلة الاستخدام للأفراد دون مهارات النمذجة المالية الواسعة.
من يجب أن يستخدم Daiwa Securities Group Inc. (8601T)؟
- المستثمرون: اتخاذ قرارات مستنيرة بأداة تقييم ذات جودة مهنية.
- المحللون الماليون: تبسيط العملية الخاصة بك مع نموذج DCF قابل للتخصيص مسبقًا.
- الاستشاريون: قم بتعديل القالب دون عناء للعروض التقديمية أو التقارير المصممة على عملائك.
- عشاق المالية: عزز معرفتك بممارسات التقييم من خلال دراسات الحالة في العالم الحقيقي.
- المعلمون والطلاب: استفد منه كمورد عملي في المناهج المتعلقة بالتمويل.
محتويات القالب
- البيانات المليئة مسبقا: ميزات الأداء المالي التاريخي لشركة Daiwa Securities Group Inc.
- نموذج التدفق النقدي المخفض: نموذج تقييم DCF قابل للتخصيص مع الحسابات الآلية.
- متوسط تكلفة رأس المال المرجح (WACC): ورقة متخصصة لحساب WACC باستخدام مدخلات مصممة.
- النسب المالية الرئيسية: تقييم ربحية دايوا ، والكفاءة التشغيلية ، والرافعة المالية.
- مدخلات قابلة للتخصيص: بسهولة تعديل نمو الإيرادات ، هوامش الربح ، ومعدلات الضرائب.
- لوحة القيادة الصافية: الصور والجداول التي تقدم نتائج التقييم الأساسية.
Disclaimer
All information, articles, and product details provided on this website are for general informational and educational purposes only. We do not claim any ownership over, nor do we intend to infringe upon, any trademarks, copyrights, logos, brand names, or other intellectual property mentioned or depicted on this site. Such intellectual property remains the property of its respective owners, and any references here are made solely for identification or informational purposes, without implying any affiliation, endorsement, or partnership.
We make no representations or warranties, express or implied, regarding the accuracy, completeness, or suitability of any content or products presented. Nothing on this website should be construed as legal, tax, investment, financial, medical, or other professional advice. In addition, no part of this site—including articles or product references—constitutes a solicitation, recommendation, endorsement, advertisement, or offer to buy or sell any securities, franchises, or other financial instruments, particularly in jurisdictions where such activity would be unlawful.
All content is of a general nature and may not address the specific circumstances of any individual or entity. It is not a substitute for professional advice or services. Any actions you take based on the information provided here are strictly at your own risk. You accept full responsibility for any decisions or outcomes arising from your use of this website and agree to release us from any liability in connection with your use of, or reliance upon, the content or products found herein.