
|
Daiwa Securities Group Inc. (8601.T) Avaliação DCF |
Totalmente Editável: Adapte-Se Às Suas Necessidades No Excel Ou Planilhas
Design Profissional: Modelos Confiáveis E Padrão Da Indústria
Pré-Construídos Para Uso Rápido E Eficiente
Compatível com MAC/PC, totalmente desbloqueado
Não É Necessária Experiência; Fácil De Seguir
Daiwa Securities Group Inc. (8601.T) Bundle
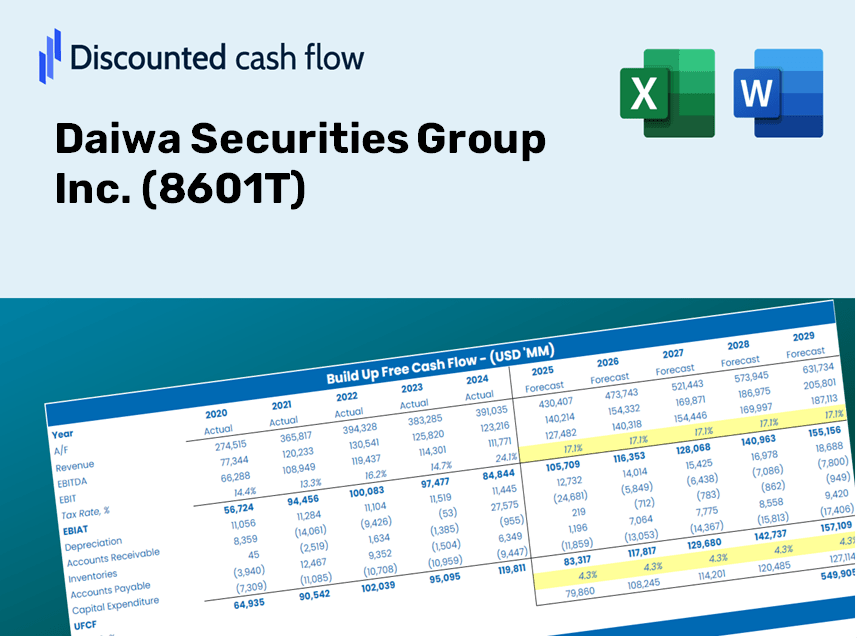
Procurando determinar o valor intrínseco do Daiwa Securities Group Inc.? Nossa calculadora DCF (8601T) integra dados do mundo real com extensos recursos de personalização, permitindo ajustar as previsões e aprimorar suas opções de investimento.
Discounted Cash Flow (DCF) - (USD MM)
| Year | AY1 2021 |
AY2 2022 |
AY3 2023 |
AY4 2024 |
AY5 2025 |
FY1 2026 |
FY2 2027 |
FY3 2028 |
FY4 2029 |
FY5 2030 |
|---|---|---|---|---|---|---|---|---|---|---|
| Revenue | 582,162.0 | 623,327.0 | 871,228.0 | 1,277,467.0 | 1,374,935.0 | 1,722,449.1 | 2,157,797.1 | 2,703,179.2 | 3,386,406.3 | 4,242,318.6 |
| Revenue Growth, % | 0 | 7.07 | 39.77 | 46.63 | 7.63 | 25.27 | 25.27 | 25.27 | 25.27 | 25.27 |
| EBITDA | 136,753.0 | 164,816.0 | 114,453.0 | 204,163.0 | 214,303.0 | 326,015.3 | 408,415.4 | 511,642.2 | 640,959.5 | 802,961.7 |
| EBITDA, % | 23.49 | 26.44 | 13.14 | 15.98 | 15.59 | 18.93 | 18.93 | 18.93 | 18.93 | 18.93 |
| Depreciation | 42,336.0 | 46,159.0 | 45,772.0 | 47,151.0 | 45,820.0 | 92,856.2 | 116,325.5 | 145,726.7 | 182,559.1 | 228,700.8 |
| Depreciation, % | 7.27 | 7.41 | 5.25 | 3.69 | 3.33 | 5.39 | 5.39 | 5.39 | 5.39 | 5.39 |
| EBIT | 94,417.0 | 118,657.0 | 68,681.0 | 157,012.0 | 168,483.0 | 233,159.1 | 292,089.9 | 365,915.5 | 458,400.4 | 574,260.8 |
| EBIT, % | 16.22 | 19.04 | 7.88 | 12.29 | 12.25 | 13.54 | 13.54 | 13.54 | 13.54 | 13.54 |
| Total Cash | 4,763,197.0 | 4,592,384.0 | 3,866,819.0 | 4,959,334.0 | 20,721,257.0 | 1,722,449.1 | 2,157,797.1 | 2,703,179.2 | 3,386,406.3 | 4,242,318.6 |
| Total Cash, percent | .0 | .0 | .0 | .0 | .0 | .0 | .0 | .0 | .0 | .0 |
| Account Receivables | 57,717.0 | .0 | 85,867.0 | 2,896,919.0 | 2,974,653.0 | 757,085.6 | 948,438.6 | 1,188,156.0 | 1,488,461.7 | 1,864,669.6 |
| Account Receivables, % | 9.91 | 0 | 9.86 | 226.77 | 216.35 | 43.95 | 43.95 | 43.95 | 43.95 | 43.95 |
| Inventories | 603.0 | 768.0 | 853.0 | 839.0 | .0 | 1,344.8 | 1,684.7 | 2,110.5 | 2,643.9 | 3,312.2 |
| Inventories, % | 0.10358 | 0.12321 | 0.09790778 | 0.06567684 | 0 | 0.07807477 | 0.07807477 | 0.07807477 | 0.07807477 | 0.07807477 |
| Accounts Payable | 5,382.0 | 6,361.0 | 8,120.0 | 8,507.0 | 8,471.0 | 14,327.4 | 17,948.7 | 22,485.2 | 28,168.3 | 35,287.8 |
| Accounts Payable, % | 0.92448 | 1.02 | 0.93202 | 0.66593 | 0.6161 | 0.8318 | 0.8318 | 0.8318 | 0.8318 | 0.8318 |
| Capital Expenditure | -58,600.0 | -85,587.0 | -81,248.0 | -64,495.0 | -46,823.0 | -143,226.5 | -179,427.0 | -224,777.0 | -281,589.3 | -352,760.8 |
| Capital Expenditure, % | -10.07 | -13.73 | -9.33 | -5.05 | -3.41 | -8.32 | -8.32 | -8.32 | -8.32 | -8.32 |
| Tax Rate, % | 29.52 | 29.52 | 29.52 | 29.52 | 29.52 | 29.52 | 29.52 | 29.52 | 29.52 | 29.52 |
| EBITAT | 70,793.6 | 79,479.1 | 45,336.2 | 106,034.6 | 118,745.6 | 161,338.5 | 202,116.8 | 253,201.7 | 317,198.2 | 397,369.9 |
| Depreciation | ||||||||||
| Changes in Account Receivables | ||||||||||
| Changes in Inventories | ||||||||||
| Changes in Accounts Payable | ||||||||||
| Capital Expenditure | ||||||||||
| UFCF | 1,591.6 | 98,582.1 | -74,332.8 | -2,721,960.4 | 40,811.6 | 2,333,047.1 | -49,056.3 | -61,455.3 | -76,988.1 | -96,446.7 |
| WACC, % | 7.78 | 7.09 | 7.01 | 7.14 | 7.39 | 7.28 | 7.28 | 7.28 | 7.28 | 7.28 |
| PV UFCF | ||||||||||
| SUM PV UFCF | 1,956,289.5 | |||||||||
| Long Term Growth Rate, % | 2.00 | |||||||||
| Free cash flow (T + 1) | -98,376 | |||||||||
| Terminal Value | -1,861,970 | |||||||||
| Present Terminal Value | -1,310,115 | |||||||||
| Enterprise Value | 646,174 | |||||||||
| Net Debt | -13,739,368 | |||||||||
| Equity Value | 14,385,542 | |||||||||
| Diluted Shares Outstanding, MM | 1,434 | |||||||||
| Equity Value Per Share | 10,031.32 |
What You Will Receive
- Authentic 8601T Financials: Access to both historical and projected data for precise valuation.
- Customizable Inputs: Adjust parameters such as WACC, tax rates, revenue growth, and capital investments.
- Automatic Calculations: Dynamic computation of intrinsic value and NPV.
- Scenario Analysis: Evaluate various scenarios to assess the future performance of Daiwa Securities Group Inc.
- User-Friendly Design: Constructed for professionals while remaining accessible to newcomers.
Key Features
- Customizable Forecast Inputs: Adjust essential variables such as revenue growth, EBITDA percentage, and capital investments.
- Instant DCF Valuation: Quickly computes intrinsic value, NPV, and additional financial metrics.
- High-Precision Accuracy: Utilizes real-world financial data from Daiwa Securities Group Inc. (8601T) for dependable valuation results.
- Simplified Scenario Analysis: Effortlessly evaluate various assumptions and analyze their outcomes.
- Efficiency Booster: Avoid the challenges of constructing intricate valuation models from the ground up.
How It Operates
- Step 1: Download the Excel file.
- Step 2: Examine the pre-filled financial data and forecasts for Daiwa Securities Group Inc. (8601T).
- Step 3: Adjust key inputs such as revenue growth, WACC, and tax rates (highlighted cells).
- Step 4: Observe the DCF model refresh in real-time as you modify your assumptions.
- Step 5: Review the outputs and utilize the findings for your investment strategies.
Why Choose the Daiwa Securities Calculator?
- Precision: Utilizes genuine Daiwa financial data to guarantee accuracy.
- Versatility: Built for users to easily experiment and adjust their inputs.
- Efficiency: Eliminate the need to create a DCF model from the ground up.
- Expert-Level: Crafted with the insights and standards expected at the CFO level.
- Accessible: Intuitive design makes it user-friendly for individuals without extensive financial modeling skills.
Who Should Utilize Daiwa Securities Group Inc. (8601T)?
- Investors: Make informed decisions with a professional-quality valuation instrument.
- Financial Analysts: Streamline your process with a customizable pre-built DCF model.
- Consultants: Effortlessly modify the template for presentations or reports tailored to your clients.
- Finance Enthusiasts: Enhance your knowledge of valuation practices through real-world case studies.
- Educators and Students: Leverage it as a practical resource in finance-related curricula.
Contents of the Template
- Pre-Filled Data: Features Daiwa Securities Group Inc.'s historical financial performance and projections.
- Discounted Cash Flow Model: Customizable DCF valuation model with automated calculations.
- Weighted Average Cost of Capital (WACC): A specialized sheet for computing WACC using tailored inputs.
- Key Financial Ratios: Assess Daiwa's profitability, operational efficiency, and financial leverage.
- Customizable Inputs: Easily modify revenue growth, profit margins, and tax rates.
- Clear Dashboard: Visuals and tables presenting essential valuation outcomes.
Disclaimer
All information, articles, and product details provided on this website are for general informational and educational purposes only. We do not claim any ownership over, nor do we intend to infringe upon, any trademarks, copyrights, logos, brand names, or other intellectual property mentioned or depicted on this site. Such intellectual property remains the property of its respective owners, and any references here are made solely for identification or informational purposes, without implying any affiliation, endorsement, or partnership.
We make no representations or warranties, express or implied, regarding the accuracy, completeness, or suitability of any content or products presented. Nothing on this website should be construed as legal, tax, investment, financial, medical, or other professional advice. In addition, no part of this site—including articles or product references—constitutes a solicitation, recommendation, endorsement, advertisement, or offer to buy or sell any securities, franchises, or other financial instruments, particularly in jurisdictions where such activity would be unlawful.
All content is of a general nature and may not address the specific circumstances of any individual or entity. It is not a substitute for professional advice or services. Any actions you take based on the information provided here are strictly at your own risk. You accept full responsibility for any decisions or outcomes arising from your use of this website and agree to release us from any liability in connection with your use of, or reliance upon, the content or products found herein.