
|
شركة Kenedix Office Investment Corporation (8972.T) DCF تقييم |
Fully Editable: Tailor To Your Needs In Excel Or Sheets
Professional Design: Trusted, Industry-Standard Templates
Investor-Approved Valuation Models
MAC/PC Compatible, Fully Unlocked
No Expertise Is Needed; Easy To Follow
Kenedix Office Investment Corporation (8972.T) Bundle
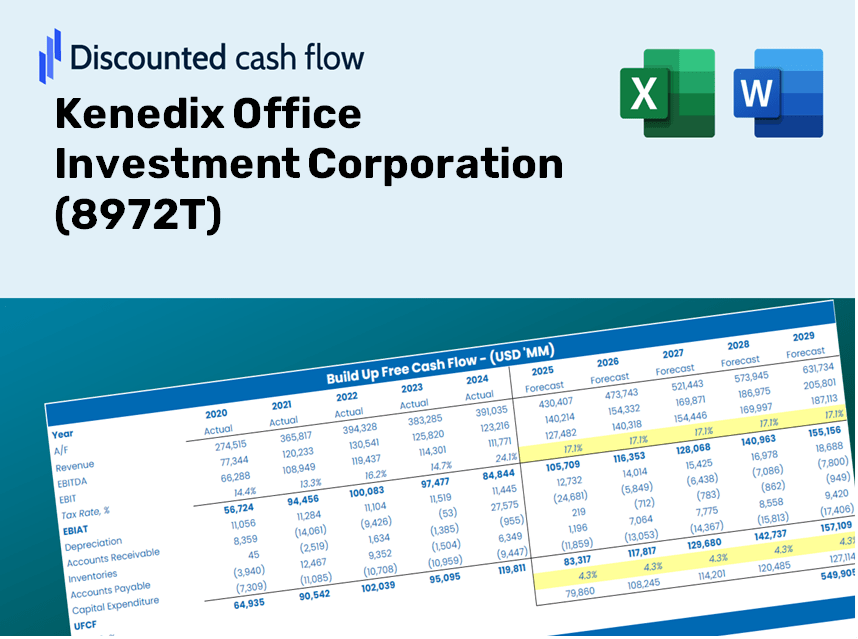
احصل على نظرة ثاقبة في تحليل تقييم Kenedix Office Investment Corporation (8972T) باستخدام حاسبة DCF الحديثة الخاصة بنا! معبأة ببيانات حقيقية (8972T) ، يمكّنك قالب Excel من ضبط التوقعات والافتراضات ، مما يتيح لك حساب القيمة الجوهرية لشركة Kenedix Office Investment Corporation بدقة.
Discounted Cash Flow (DCF) - (USD MM)
| Year | AY1 2021 |
AY2 2022 |
AY3 2023 |
AY4 2024 |
AY5 2025 |
FY1 2026 |
FY2 2027 |
FY3 2028 |
FY4 2029 |
FY5 2030 |
|---|---|---|---|---|---|---|---|---|---|---|
| Revenue | 31,987.2 | 31,329.9 | 32,157.5 | 33,946.3 | 78,060.7 | 98,775.9 | 124,988.4 | 158,157.1 | 200,127.8 | 253,236.4 |
| Revenue Growth, % | 0 | -2.05 | 2.64 | 5.56 | 129.95 | 26.54 | 26.54 | 26.54 | 26.54 | 26.54 |
| EBITDA | 20,140.9 | 19,664.7 | 19,696.9 | 21,182.5 | 63,664.1 | 65,378.0 | 82,727.5 | 104,681.3 | 132,460.9 | 167,612.5 |
| EBITDA, % | 62.97 | 62.77 | 61.25 | 62.4 | 81.56 | 66.19 | 66.19 | 66.19 | 66.19 | 66.19 |
| Depreciation | 4,994.6 | 5,116.5 | 5,220.1 | 5,433.4 | 9,868.9 | 15,177.2 | 19,204.9 | 24,301.4 | 30,750.3 | 38,910.6 |
| Depreciation, % | 15.61 | 16.33 | 16.23 | 16.01 | 12.64 | 15.37 | 15.37 | 15.37 | 15.37 | 15.37 |
| EBIT | 15,146.2 | 14,548.2 | 14,476.9 | 15,749.1 | 53,795.2 | 50,200.7 | 63,522.7 | 80,379.9 | 101,710.6 | 128,701.9 |
| EBIT, % | 47.35 | 46.44 | 45.02 | 46.39 | 68.91 | 50.82 | 50.82 | 50.82 | 50.82 | 50.82 |
| Total Cash | 16,128.9 | 19,273.8 | 20,376.0 | 28,936.0 | 24,855.7 | 57,761.7 | 73,090.1 | 92,486.3 | 117,029.7 | 148,086.3 |
| Total Cash, percent | .0 | .0 | .0 | .0 | .0 | .0 | .0 | .0 | .0 | .0 |
| Account Receivables | 336.2 | 286.1 | 396.2 | 377.7 | 1,015.6 | 1,108.3 | 1,402.4 | 1,774.6 | 2,245.5 | 2,841.5 |
| Account Receivables, % | 1.05 | 0.91321 | 1.23 | 1.11 | 1.3 | 1.12 | 1.12 | 1.12 | 1.12 | 1.12 |
| Inventories | 12,152.0 | 11,544.0 | 11,858.2 | .0 | .0 | 22,068.9 | 27,925.5 | 35,336.1 | 44,713.4 | 56,579.2 |
| Inventories, % | 37.99 | 36.85 | 36.88 | 0 | 0 | 22.34 | 22.34 | 22.34 | 22.34 | 22.34 |
| Accounts Payable | 1,496.6 | 1,642.7 | 1,737.4 | 2,091.6 | 3,173.6 | 5,047.8 | 6,387.4 | 8,082.4 | 10,227.2 | 12,941.3 |
| Accounts Payable, % | 4.68 | 5.24 | 5.4 | 6.16 | 4.07 | 5.11 | 5.11 | 5.11 | 5.11 | 5.11 |
| Capital Expenditure | -27,393.9 | -2,353.0 | -22,057.8 | -1,839.0 | -75,202.1 | -52,054.7 | -65,868.7 | -83,348.5 | -105,467.0 | -133,455.2 |
| Capital Expenditure, % | -85.64 | -7.51 | -68.59 | -5.42 | -96.34 | -52.7 | -52.7 | -52.7 | -52.7 | -52.7 |
| Tax Rate, % | 0.00250826 | 0.00250826 | 0.00250826 | 0.00250826 | 0.00250826 | 0.00250826 | 0.00250826 | 0.00250826 | 0.00250826 | 0.00250826 |
| EBITAT | 15,143.5 | 14,545.5 | 14,474.0 | 15,744.1 | 53,793.8 | 50,191.5 | 63,511.0 | 80,365.2 | 101,692.0 | 128,678.4 |
| Depreciation | ||||||||||
| Changes in Account Receivables | ||||||||||
| Changes in Inventories | ||||||||||
| Changes in Accounts Payable | ||||||||||
| Capital Expenditure | ||||||||||
| UFCF | -18,247.4 | 18,113.3 | -2,693.5 | 31,569.5 | -11,095.3 | -6,973.5 | 12,036.1 | 15,230.2 | 19,271.9 | 24,386.2 |
| WACC, % | 4.6 | 4.6 | 4.6 | 4.6 | 4.6 | 4.6 | 4.6 | 4.6 | 4.6 | 4.6 |
| PV UFCF | ||||||||||
| SUM PV UFCF | 53,218.1 | |||||||||
| Long Term Growth Rate, % | 2.00 | |||||||||
| Free cash flow (T + 1) | 24,874 | |||||||||
| Terminal Value | 957,011 | |||||||||
| Present Terminal Value | 764,323 | |||||||||
| Enterprise Value | 817,541 | |||||||||
| Net Debt | 523,544 | |||||||||
| Equity Value | 293,997 | |||||||||
| Diluted Shares Outstanding, MM | 4 | |||||||||
| Equity Value Per Share | 72,075.65 |
فوائد اختيار شركة Kenedix Office Investment Corporation
- نموذج مالي شامل: استفد من بيانات Kenedix الفعلية لتقييم DCF الدقيق.
- إجمالي مرونة التنبؤ: تعديل نمو الإيرادات وهامش التشغيل ومعدلات الخصم والعوامل الأساسية الأخرى.
- الحسابات في الوقت الحقيقي: توفر التحديثات التلقائية نتائج فورية أثناء ضبط المعلمات.
- القالب المهني: ملف Excel المصقول المصنوع لتقييم الاستثمار من الدرجة الأولى.
- قابلة للتكيف وقابلة للتكرار: تم تصميمه للبراعة ، والسماح بالاستخدام المستمر في التنبؤ المالي التفصيلي.
الميزات الرئيسية
- 🔍 واقعية Kenedix Office Investment Corporation Financial: بيانات تاريخية ومتوقعة مملوءة مسبقًا لشركة Kenedix Office Investment Corporation (8972T).
- ✏️ مدخلات قابلة للتخصيص بالكامل: تعديل جميع المعلمات الأساسية (الخلايا الصفراء) مثل WACC و Growth ٪ ومعدلات الضرائب.
- 📊 تقييم DCF المهني: تقيم الصيغ المتكاملة القيمة الجوهرية لـ Kenedix من خلال طريقة التدفق النقدي المخفض.
- ⚡ النتائج الفورية: انظر تقييم Kenedix فور إجراء التحديثات.
- تحليل السيناريو: تقييم ومقارنة النتائج للافتراضات المالية المختلفة جنبًا إلى جنب.
كيف تعمل
- تحميل: احصل على ملف Excel الذي تم تكوينه مسبقًا يحتوي على البيانات المالية لشركة Kenedix Office Investment Corporation (8972T).
- تخصيص: توقعات خياط مثل نمو الإيرادات ، EBITDA ٪ ، و WACC لتناسب تحليلك.
- التحديث تلقائيًا: مشاهدة كقيمة جوهرية وحسابات NPV تحديث في الوقت الفعلي.
- سيناريوهات الاختبار: تطوير توقعات مختلفة ومقارنة النتائج على الفور.
- اتخاذ القرارات: الاستفادة من رؤى التقييم لإبلاغ استراتيجيتك الاستثمارية.
لماذا تختار حاسبة استثمار Office Kenedix؟
- دقة: يستخدم بيانات Kenedix المالية التي تم التحقق منها لضمان الموثوقية.
- القدرة على التكيف: تم تصميمه للسماح للمستخدمين بسهولة استكشاف وضبط المدخلات حسب الحاجة.
- كفاءة: التخلص من الحاجة إلى إنشاء نموذج DCF من الألف إلى الياء.
- جودة عالية: مصنوع بمعايير المدير المالي لتقديم كل من الدقة والوظائف.
- حدسي: واجهة سهلة الاستخدام يمكن الوصول إليها لأولئك الذين ليس لديهم معرفة نماذج مالية واسعة النطاق.
من يجب أن يستخدم شركة Kenedix Office Investment Corporation (8972T)؟
- المستثمرون: كسب الرؤى اللازمة لاتخاذ قرارات استثمار مستنيرة من خلال أداة تقييم من الدرجة الأولى.
- المحللون الماليون: قم بتبسيط سير العمل الخاص بك باستخدام نموذج DCF جاهز للاستخدام يمكن تخصيصه بسهولة.
- الاستشاريون: قم بتعديل القالب دون جهد لعروض العميل المؤثرة أو التقارير الشاملة.
- عشاق المالية: عزز معرفتك بطرق التقييم من خلال التطبيقات العملية الواقعية.
- المعلمون والطلاب: توظيفها كمورد قيم للتعلم العملي في دورات التمويل.
محتويات القالب
- نموذج DCF شامل: قالب قابل للتحرير يضم حسابات التقييم الواسعة.
- بيانات العالم الحقيقي: أرقام مالية تاريخية ومتوقعة لشركة Kenedix Office Corporation المحلية للتحليل الشامل.
- افتراضات قابلة للتخصيص: تعديل WACC ومعدلات النمو والتقديرات الضريبية لاستكشاف السيناريوهات المختلفة.
- البيانات المالية: الانهيارات السنوية والفصلية الكاملة للتحليل المتعمق.
- النسب المالية الرئيسية: تحليل متكامل للربحية والكفاءة والرافعة المالية.
- لوحة القيادة مع البيانات المرئية: الرسوم البيانية والجداول للرؤى الواضحة والقابلة للتنفيذ.
Disclaimer
All information, articles, and product details provided on this website are for general informational and educational purposes only. We do not claim any ownership over, nor do we intend to infringe upon, any trademarks, copyrights, logos, brand names, or other intellectual property mentioned or depicted on this site. Such intellectual property remains the property of its respective owners, and any references here are made solely for identification or informational purposes, without implying any affiliation, endorsement, or partnership.
We make no representations or warranties, express or implied, regarding the accuracy, completeness, or suitability of any content or products presented. Nothing on this website should be construed as legal, tax, investment, financial, medical, or other professional advice. In addition, no part of this site—including articles or product references—constitutes a solicitation, recommendation, endorsement, advertisement, or offer to buy or sell any securities, franchises, or other financial instruments, particularly in jurisdictions where such activity would be unlawful.
All content is of a general nature and may not address the specific circumstances of any individual or entity. It is not a substitute for professional advice or services. Any actions you take based on the information provided here are strictly at your own risk. You accept full responsibility for any decisions or outcomes arising from your use of this website and agree to release us from any liability in connection with your use of, or reliance upon, the content or products found herein.