
|
Valoración de DCF de Kenedix Office Investment Corporation (8972.T) |
Completamente Editable: Adáptelo A Sus Necesidades En Excel O Sheets
Diseño Profesional: Plantillas Confiables Y Estándares De La Industria
Predeterminadas Para Un Uso Rápido Y Eficiente
Compatible con MAC / PC, completamente desbloqueado
No Se Necesita Experiencia; Fáciles De Seguir
Kenedix Office Investment Corporation (8972.T) Bundle
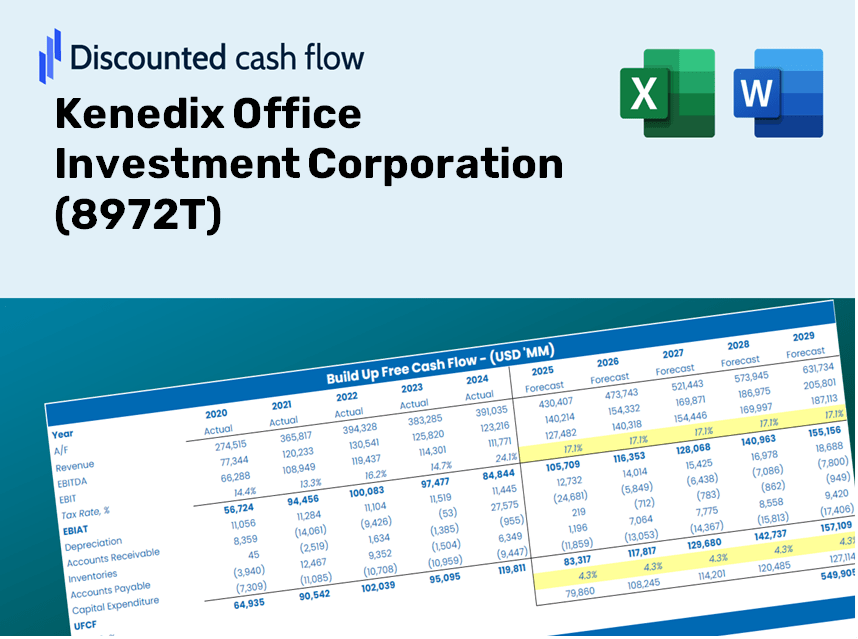
¡Obtenga información sobre su análisis de valoración de Kenedix Office Investment Corporation (8972T) utilizando nuestra calculadora DCF de última generación! Repleto de datos reales (8972T), esta plantilla de Excel le permite ajustar los pronósticos y los supuestos, lo que le permite calcular el valor intrínseco de la corporación de inversión de la oficina de Kenedix con precisión.
Discounted Cash Flow (DCF) - (USD MM)
| Year | AY1 2021 |
AY2 2022 |
AY3 2023 |
AY4 2024 |
AY5 2025 |
FY1 2026 |
FY2 2027 |
FY3 2028 |
FY4 2029 |
FY5 2030 |
|---|---|---|---|---|---|---|---|---|---|---|
| Revenue | 31,987.2 | 31,329.9 | 32,157.5 | 33,946.3 | 78,060.7 | 98,775.9 | 124,988.4 | 158,157.1 | 200,127.8 | 253,236.4 |
| Revenue Growth, % | 0 | -2.05 | 2.64 | 5.56 | 129.95 | 26.54 | 26.54 | 26.54 | 26.54 | 26.54 |
| EBITDA | 20,140.9 | 19,664.7 | 19,696.9 | 21,182.5 | 63,664.1 | 65,378.0 | 82,727.5 | 104,681.3 | 132,460.9 | 167,612.5 |
| EBITDA, % | 62.97 | 62.77 | 61.25 | 62.4 | 81.56 | 66.19 | 66.19 | 66.19 | 66.19 | 66.19 |
| Depreciation | 4,994.6 | 5,116.5 | 5,220.1 | 5,433.4 | 9,868.9 | 15,177.2 | 19,204.9 | 24,301.4 | 30,750.3 | 38,910.6 |
| Depreciation, % | 15.61 | 16.33 | 16.23 | 16.01 | 12.64 | 15.37 | 15.37 | 15.37 | 15.37 | 15.37 |
| EBIT | 15,146.2 | 14,548.2 | 14,476.9 | 15,749.1 | 53,795.2 | 50,200.7 | 63,522.7 | 80,379.9 | 101,710.6 | 128,701.9 |
| EBIT, % | 47.35 | 46.44 | 45.02 | 46.39 | 68.91 | 50.82 | 50.82 | 50.82 | 50.82 | 50.82 |
| Total Cash | 16,128.9 | 19,273.8 | 20,376.0 | 28,936.0 | 24,855.7 | 57,761.7 | 73,090.1 | 92,486.3 | 117,029.7 | 148,086.3 |
| Total Cash, percent | .0 | .0 | .0 | .0 | .0 | .0 | .0 | .0 | .0 | .0 |
| Account Receivables | 336.2 | 286.1 | 396.2 | 377.7 | 1,015.6 | 1,108.3 | 1,402.4 | 1,774.6 | 2,245.5 | 2,841.5 |
| Account Receivables, % | 1.05 | 0.91321 | 1.23 | 1.11 | 1.3 | 1.12 | 1.12 | 1.12 | 1.12 | 1.12 |
| Inventories | 12,152.0 | 11,544.0 | 11,858.2 | .0 | .0 | 22,068.9 | 27,925.5 | 35,336.1 | 44,713.4 | 56,579.2 |
| Inventories, % | 37.99 | 36.85 | 36.88 | 0 | 0 | 22.34 | 22.34 | 22.34 | 22.34 | 22.34 |
| Accounts Payable | 1,496.6 | 1,642.7 | 1,737.4 | 2,091.6 | 3,173.6 | 5,047.8 | 6,387.4 | 8,082.4 | 10,227.2 | 12,941.3 |
| Accounts Payable, % | 4.68 | 5.24 | 5.4 | 6.16 | 4.07 | 5.11 | 5.11 | 5.11 | 5.11 | 5.11 |
| Capital Expenditure | -27,393.9 | -2,353.0 | -22,057.8 | -1,839.0 | -75,202.1 | -52,054.7 | -65,868.7 | -83,348.5 | -105,467.0 | -133,455.2 |
| Capital Expenditure, % | -85.64 | -7.51 | -68.59 | -5.42 | -96.34 | -52.7 | -52.7 | -52.7 | -52.7 | -52.7 |
| Tax Rate, % | 0.00250826 | 0.00250826 | 0.00250826 | 0.00250826 | 0.00250826 | 0.00250826 | 0.00250826 | 0.00250826 | 0.00250826 | 0.00250826 |
| EBITAT | 15,143.5 | 14,545.5 | 14,474.0 | 15,744.1 | 53,793.8 | 50,191.5 | 63,511.0 | 80,365.2 | 101,692.0 | 128,678.4 |
| Depreciation | ||||||||||
| Changes in Account Receivables | ||||||||||
| Changes in Inventories | ||||||||||
| Changes in Accounts Payable | ||||||||||
| Capital Expenditure | ||||||||||
| UFCF | -18,247.4 | 18,113.3 | -2,693.5 | 31,569.5 | -11,095.3 | -6,973.5 | 12,036.1 | 15,230.2 | 19,271.9 | 24,386.2 |
| WACC, % | 4.6 | 4.6 | 4.6 | 4.6 | 4.6 | 4.6 | 4.6 | 4.6 | 4.6 | 4.6 |
| PV UFCF | ||||||||||
| SUM PV UFCF | 53,218.1 | |||||||||
| Long Term Growth Rate, % | 2.00 | |||||||||
| Free cash flow (T + 1) | 24,874 | |||||||||
| Terminal Value | 957,011 | |||||||||
| Present Terminal Value | 764,323 | |||||||||
| Enterprise Value | 817,541 | |||||||||
| Net Debt | 523,544 | |||||||||
| Equity Value | 293,997 | |||||||||
| Diluted Shares Outstanding, MM | 4 | |||||||||
| Equity Value Per Share | 72,075.65 |
Benefits of Choosing Kenedix Office Investment Corporation
- Comprehensive Financial Model: Leverage Kenedix’s actual data for accurate DCF valuation.
- Total Forecast Flexibility: Modify revenue growth, operating margins, discount rates, and other essential factors.
- Real-Time Calculations: Automatic updates provide immediate results as you adjust parameters.
- Professional Template: A polished Excel file crafted for top-tier investment valuation.
- Adaptable and Repeatable: Designed for versatility, allowing for continuous use in detailed financial forecasting.
Key Features
- 🔍 Real-Life Kenedix Office Investment Corporation Financials: Pre-filled historical and projected data for Kenedix Office Investment Corporation (8972T).
- ✏️ Fully Customizable Inputs: Modify all essential parameters (yellow cells) such as WACC, growth %, and tax rates.
- 📊 Professional DCF Valuation: Integrated formulas assess Kenedix's intrinsic value through the Discounted Cash Flow method.
- ⚡ Instant Results: See Kenedix's valuation immediately after making updates.
- Scenario Analysis: Evaluate and compare results for different financial assumptions side-by-side.
How It Functions
- Download: Obtain the pre-configured Excel file containing Kenedix Office Investment Corporation’s (8972T) financial data.
- Customize: Tailor projections such as revenue growth, EBITDA %, and WACC to fit your analysis.
- Update Automatically: Watch as intrinsic value and NPV calculations refresh in real-time.
- Test Scenarios: Develop various projections and instantly compare the results.
- Make Decisions: Leverage the valuation insights to inform your investment strategy.
Why Opt for the Kenedix Office Investment Calculator?
- Precision: Utilizes verified Kenedix financial data to ensure reliability.
- Adaptability: Built to allow users to easily explore and adjust inputs as needed.
- Efficiency: Eliminate the need to create a DCF model from the ground up.
- High-Quality: Crafted with the standards of a CFO to offer both accuracy and functionality.
- Intuitive: User-friendly interface accessible for those without extensive financial modeling knowledge.
Who Should Utilize Kenedix Office Investment Corporation (8972T)?
- Investors: Gain the insights needed to make informed investment decisions with a top-tier valuation tool.
- Financial Analysts: Streamline your workflow with a ready-to-use DCF model that can be easily customized.
- Consultants: Effortlessly modify the template for impactful client presentations or comprehensive reports.
- Finance Enthusiasts: Enhance your knowledge of valuation methods through practical, real-world applications.
- Educators and Students: Employ it as a valuable resource for hands-on learning in finance courses.
Contents of the Template
- Thorough DCF Model: An editable template featuring extensive valuation computations.
- Real-World Data: Kenedix Office Investment Corporation’s historical and projected financial figures preloaded for comprehensive analysis.
- Customizable Assumptions: Modify WACC, growth rates, and tax estimations to explore various scenarios.
- Financial Statements: Complete annual and quarterly breakdowns for in-depth analysis.
- Key Financial Ratios: Integrated analysis of profitability, efficiency, and leverage metrics.
- Dashboard with Visual Data: Graphs and tables for clear and actionable insights.
Disclaimer
All information, articles, and product details provided on this website are for general informational and educational purposes only. We do not claim any ownership over, nor do we intend to infringe upon, any trademarks, copyrights, logos, brand names, or other intellectual property mentioned or depicted on this site. Such intellectual property remains the property of its respective owners, and any references here are made solely for identification or informational purposes, without implying any affiliation, endorsement, or partnership.
We make no representations or warranties, express or implied, regarding the accuracy, completeness, or suitability of any content or products presented. Nothing on this website should be construed as legal, tax, investment, financial, medical, or other professional advice. In addition, no part of this site—including articles or product references—constitutes a solicitation, recommendation, endorsement, advertisement, or offer to buy or sell any securities, franchises, or other financial instruments, particularly in jurisdictions where such activity would be unlawful.
All content is of a general nature and may not address the specific circumstances of any individual or entity. It is not a substitute for professional advice or services. Any actions you take based on the information provided here are strictly at your own risk. You accept full responsibility for any decisions or outcomes arising from your use of this website and agree to release us from any liability in connection with your use of, or reliance upon, the content or products found herein.