
|
Daiwa Office Investment Corporation (8976.T) DCF تقييم |
Fully Editable: Tailor To Your Needs In Excel Or Sheets
Professional Design: Trusted, Industry-Standard Templates
Investor-Approved Valuation Models
MAC/PC Compatible, Fully Unlocked
No Expertise Is Needed; Easy To Follow
Daiwa Office Investment Corporation (8976.T) Bundle
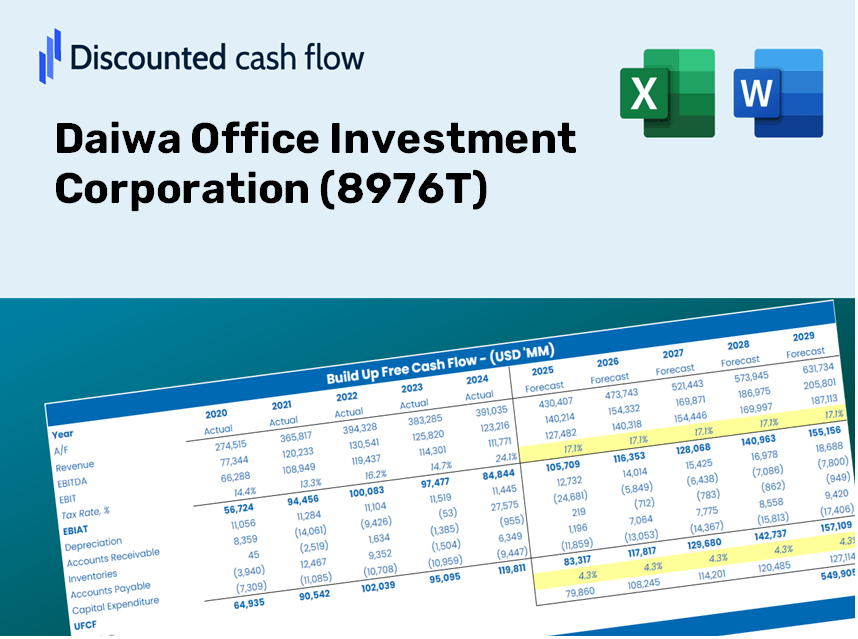
استكشف الآفاق المالية لشركة Daiwa Office Investment Corporation (8976T) مع حاسبة DCF سهلة الاستخدام! ما عليك سوى إدخال توقعاتك للنمو والهوامش والمصروفات لتحديد القيمة الجوهرية لشركة Daiwa Office Investment Corporation (8976T) وصقل نهج الاستثمار الخاص بك.
Discounted Cash Flow (DCF) - (USD MM)
| Year | AY1 2020 |
AY2 2021 |
AY3 2022 |
AY4 2023 |
AY5 2024 |
FY1 2025 |
FY2 2026 |
FY3 2027 |
FY4 2028 |
FY5 2029 |
|---|---|---|---|---|---|---|---|---|---|---|
| Revenue | 29,122.6 | 28,937.2 | 28,366.2 | 28,696.6 | 28,786.4 | 28,705.0 | 28,623.7 | 28,542.7 | 28,462.0 | 28,381.4 |
| Revenue Growth, % | 0 | -0.6366 | -1.97 | 1.16 | 0.31312 | -0.28298 | -0.28298 | -0.28298 | -0.28298 | -0.28298 |
| EBITDA | 18,701.5 | 19,120.3 | 18,562.0 | 17,708.9 | 18,253.3 | 18,419.9 | 18,367.8 | 18,315.8 | 18,264.0 | 18,212.3 |
| EBITDA, % | 64.22 | 66.08 | 65.44 | 61.71 | 63.41 | 64.17 | 64.17 | 64.17 | 64.17 | 64.17 |
| Depreciation | 3,672.8 | 3,631.7 | 3,577.3 | 3,588.1 | 3,750.0 | 3,634.3 | 3,624.0 | 3,613.7 | 3,603.5 | 3,593.3 |
| Depreciation, % | 12.61 | 12.55 | 12.61 | 12.5 | 13.03 | 12.66 | 12.66 | 12.66 | 12.66 | 12.66 |
| EBIT | 15,028.7 | 15,488.6 | 14,984.7 | 14,120.8 | 14,503.3 | 14,785.7 | 14,743.8 | 14,702.1 | 14,660.5 | 14,619.0 |
| EBIT, % | 51.6 | 53.53 | 52.83 | 49.21 | 50.38 | 51.51 | 51.51 | 51.51 | 51.51 | 51.51 |
| Total Cash | 28,137.8 | 26,650.6 | 19,084.3 | 25,875.6 | 29,401.0 | 25,614.3 | 25,541.8 | 25,469.5 | 25,397.5 | 25,325.6 |
| Total Cash, percent | .0 | .0 | .0 | .0 | .0 | .0 | .0 | .0 | .0 | .0 |
| Account Receivables | 367.7 | 189.9 | 100.0 | 96.0 | 110.6 | 171.7 | 171.2 | 170.7 | 170.2 | 169.7 |
| Account Receivables, % | 1.26 | 0.6563 | 0.35253 | 0.33451 | 0.38423 | 0.59802 | 0.59802 | 0.59802 | 0.59802 | 0.59802 |
| Inventories | 4,047.3 | 3,981.1 | 4,095.9 | .0 | -130.8 | 2,390.6 | 2,383.8 | 2,377.0 | 2,370.3 | 2,363.6 |
| Inventories, % | 13.9 | 13.76 | 14.44 | 0 | -0.4545 | 8.33 | 8.33 | 8.33 | 8.33 | 8.33 |
| Accounts Payable | 1,673.0 | 813.8 | 1,514.2 | 1,287.0 | 916.1 | 1,237.9 | 1,234.4 | 1,230.9 | 1,227.4 | 1,223.9 |
| Accounts Payable, % | 5.74 | 2.81 | 5.34 | 4.48 | 3.18 | 4.31 | 4.31 | 4.31 | 4.31 | 4.31 |
| Capital Expenditure | -11,257.4 | -3,816.2 | -14,483.4 | -4,056.5 | -11,382.9 | -8,989.3 | -8,963.8 | -8,938.5 | -8,913.2 | -8,888.0 |
| Capital Expenditure, % | -38.66 | -13.19 | -51.06 | -14.14 | -39.54 | -31.32 | -31.32 | -31.32 | -31.32 | -31.32 |
| Tax Rate, % | 0.01317663 | 0.01317663 | 0.01317663 | 0.01317663 | 0.01317663 | 0.01317663 | 0.01317663 | 0.01317663 | 0.01317663 | 0.01317663 |
| EBITAT | 15,026.8 | 15,503.6 | 15,002.5 | 14,163.1 | 14,501.4 | 14,784.9 | 14,743.1 | 14,701.4 | 14,659.8 | 14,618.3 |
| Depreciation | ||||||||||
| Changes in Account Receivables | ||||||||||
| Changes in Inventories | ||||||||||
| Changes in Accounts Payable | ||||||||||
| Capital Expenditure | ||||||||||
| UFCF | 4,700.3 | 14,703.8 | 4,771.9 | 17,567.5 | 6,613.8 | 7,169.3 | 9,407.0 | 9,380.3 | 9,353.8 | 9,327.3 |
| WACC, % | 4.17 | 4.17 | 4.17 | 4.17 | 4.17 | 4.17 | 4.17 | 4.17 | 4.17 | 4.17 |
| PV UFCF | ||||||||||
| SUM PV UFCF | 39,399.0 | |||||||||
| Long Term Growth Rate, % | 3.00 | |||||||||
| Free cash flow (T + 1) | 9,607 | |||||||||
| Terminal Value | 822,278 | |||||||||
| Present Terminal Value | 670,409 | |||||||||
| Enterprise Value | 709,808 | |||||||||
| Net Debt | 189,998 | |||||||||
| Equity Value | 519,809 | |||||||||
| Diluted Shares Outstanding, MM | 1 | |||||||||
| Equity Value Per Share | 546,538.79 |
فوائد استخدام نموذجنا
- مدخلات التنبؤ المرنة: تعديل الافتراضات الرئيسية (النمو ٪ ، الهوامش ، WACC) دون عناء لاستكشاف سيناريوهات مختلفة.
- بيانات الوقت الحقيقي: المعلومات المالية لشركة Daiwa Office Investment Corporation (8976T) تم تحميلها مسبقًا لتسهيل تحليلك.
- حسابات DCF الفورية: يحسب القالب تلقائيًا القيمة الحالية الصافية (NPV) والقيمة الجوهرية لراحتك.
- تصميم مصمم خصيصًا ومهنيًا: نموذج Excel المكرر الذي يلبي متطلبات التقييم الخاصة بك بسهولة.
- مصمم للمحللين والمستثمرين: مثالي لتقييم التوقعات ، وتأكيد الاستراتيجيات ، وتحسين وقتك.
الميزات الرئيسية
- مقاييس الاستثمار القابلة للتخصيص: اضبط المتغيرات الأساسية مثل نمو إيجار الإيجار ونفقات التشغيل وتكاليف الاستحواذ.
- تقييم DCF الفوري: يحسب بسرعة القيمة الجوهرية ، والقيمة الحالية الصافية (NPV) ، والمقاييس الأساسية الأخرى.
- دقة عالية الدقة: تقوم شركة Daiwa Office Investment Corporation [8976T] بالبيانات المالية الفعلية لرؤى تقييم موثوقة.
- تحليل السيناريو السهل: استكشاف مختلف الافتراضات بسهولة وتقييم تأثيرها على النتائج.
- داعم الكفاءة: تجنب تعقيد بناء نماذج التقييم المعقدة من الألف إلى الياء.
كيف تعمل
- الخطوة 1: قم بتنزيل قالب Excel Prebuilt الذي يضم بيانات Daiwa Office Investment Corporation (8976T).
- الخطوة 2: راجع الأوراق المملوءة مسبقًا للتعرف على المقاييس الأساسية.
- الخطوة 3: ضبط التوقعات والافتراضات داخل الخلايا الصفراء القابلة للتحرير (WACC ، النمو ، الهوامش).
- الخطوة 4: انظر على الفور النتائج المحدثة ، بما في ذلك القيمة الجوهرية لشركة Daiwa Office Investment Corporation.
- الخطوة 5: اتخاذ قرارات استثمارية مستنيرة أو إنشاء تقارير باستخدام المخرجات التي تم إنشاؤها.
لماذا حدد هذه الآلة الحاسبة؟
- سهلة الاستخدام ويمكن الوصول إليها: صُنعت لكل من المبتدئين والمستخدمين المتمرسين.
- مدخلات قابلة للتخصيص: بسهولة ضبط المعلمات لتناسب تحليلك المحدد.
- ردود فعل فورية: راقب التقلبات في الوقت الفعلي في تقييم شركة Daiwa Office Investment Corporation أثناء تعديل المدخلات.
- البيانات التي تم تحميلها مسبقًا: يأتي مع المقاييس المالية الفعلية لشركة Daiwa Office Investment Corporation (8976T) للتقييمات السريعة.
- أقره خبراء الصناعة: يفضله المستثمرون والمحللين لاتخاذ القرارات السليمة.
من يجب أن يستخدم هذا المنتج؟
- المستثمرون: تقييم تقييم شركة Daiwa Office Investment Corporation (8976T) قبل اتخاذ قرارات شراء أو بيع.
- الماليين والمحللين الماليين: تعزيز عمليات التقييم وتقييم التوقعات المالية.
- مؤسسو الشركات الناشئة: اكتساب نظرة ثاقبة على مدى قيمة استثمار العقارات مثل Daiwa Office Investment Corporation (8976T).
- الاستشاريون: تزويد العملاء بتقارير تقييم مفصلة ومهنية.
- الطلاب والمعلمين: دمج أمثلة في العالم الحقيقي لممارسة وتعليم منهجيات التقييم.
محتويات القالب
- نموذج DCF شامل: قالب قابل للتحرير يتميز بحسابات تقييم شاملة.
- بيانات العالم الحقيقي: تم تحصيل البيانات المالية التاريخية والمتوقعة لشركة Daiwa Office Investment Corporation (8976T) لتحليلها الثاقبة.
- المعلمات القابلة للتخصيص: تعديل WACC ومعدلات النمو والافتراضات الضريبية لاستكشاف السيناريوهات المختلفة.
- البيانات المالية: تفاصيل سنوية وفصلية مفصلة لفهم تعزيز.
- النسب الرئيسية: التحليل المتكامل يركز على الربحية والكفاءة والاستفادة من المقاييس.
- لوحة القيادة مع المخرجات المرئية: المخططات والجداول المصممة لتقديم رؤى واضحة وقابلة للتنفيذ.
Disclaimer
All information, articles, and product details provided on this website are for general informational and educational purposes only. We do not claim any ownership over, nor do we intend to infringe upon, any trademarks, copyrights, logos, brand names, or other intellectual property mentioned or depicted on this site. Such intellectual property remains the property of its respective owners, and any references here are made solely for identification or informational purposes, without implying any affiliation, endorsement, or partnership.
We make no representations or warranties, express or implied, regarding the accuracy, completeness, or suitability of any content or products presented. Nothing on this website should be construed as legal, tax, investment, financial, medical, or other professional advice. In addition, no part of this site—including articles or product references—constitutes a solicitation, recommendation, endorsement, advertisement, or offer to buy or sell any securities, franchises, or other financial instruments, particularly in jurisdictions where such activity would be unlawful.
All content is of a general nature and may not address the specific circumstances of any individual or entity. It is not a substitute for professional advice or services. Any actions you take based on the information provided here are strictly at your own risk. You accept full responsibility for any decisions or outcomes arising from your use of this website and agree to release us from any liability in connection with your use of, or reliance upon, the content or products found herein.