
|
Daiwa Office Investment Corporation (8976.t) DCF -Bewertung |
Fully Editable: Tailor To Your Needs In Excel Or Sheets
Professional Design: Trusted, Industry-Standard Templates
Investor-Approved Valuation Models
MAC/PC Compatible, Fully Unlocked
No Expertise Is Needed; Easy To Follow
Daiwa Office Investment Corporation (8976.T) Bundle
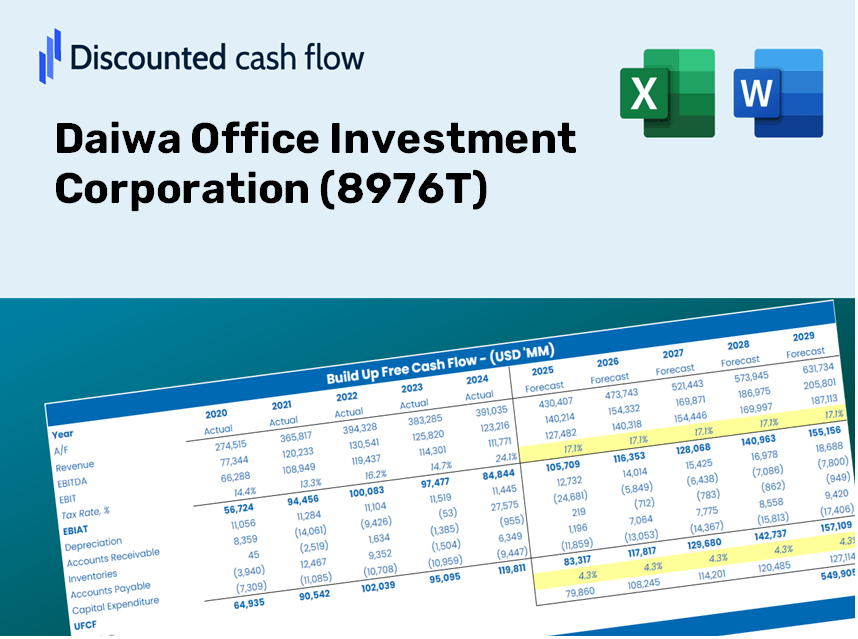
Erfahren Sie die finanziellen Aussichten der Daiwa Office Investment Corporation (8976T) mit unserem benutzerfreundlichen DCF-Taschenrechner! Geben Sie einfach Ihre Prognosen für Wachstum, Margen und Ausgaben ein, um den inneren Wert der Daiwa Office Investment Corporation (8976T) zu bestimmen und verfeinern Sie Ihren Investitionsansatz.
Discounted Cash Flow (DCF) - (USD MM)
| Year | AY1 2020 |
AY2 2021 |
AY3 2022 |
AY4 2023 |
AY5 2024 |
FY1 2025 |
FY2 2026 |
FY3 2027 |
FY4 2028 |
FY5 2029 |
|---|---|---|---|---|---|---|---|---|---|---|
| Revenue | 29,122.6 | 28,937.2 | 28,366.2 | 28,696.6 | 28,786.4 | 28,705.0 | 28,623.7 | 28,542.7 | 28,462.0 | 28,381.4 |
| Revenue Growth, % | 0 | -0.6366 | -1.97 | 1.16 | 0.31312 | -0.28298 | -0.28298 | -0.28298 | -0.28298 | -0.28298 |
| EBITDA | 18,701.5 | 19,120.3 | 18,562.0 | 17,708.9 | 18,253.3 | 18,419.9 | 18,367.8 | 18,315.8 | 18,264.0 | 18,212.3 |
| EBITDA, % | 64.22 | 66.08 | 65.44 | 61.71 | 63.41 | 64.17 | 64.17 | 64.17 | 64.17 | 64.17 |
| Depreciation | 3,672.8 | 3,631.7 | 3,577.3 | 3,588.1 | 3,750.0 | 3,634.3 | 3,624.0 | 3,613.7 | 3,603.5 | 3,593.3 |
| Depreciation, % | 12.61 | 12.55 | 12.61 | 12.5 | 13.03 | 12.66 | 12.66 | 12.66 | 12.66 | 12.66 |
| EBIT | 15,028.7 | 15,488.6 | 14,984.7 | 14,120.8 | 14,503.3 | 14,785.7 | 14,743.8 | 14,702.1 | 14,660.5 | 14,619.0 |
| EBIT, % | 51.6 | 53.53 | 52.83 | 49.21 | 50.38 | 51.51 | 51.51 | 51.51 | 51.51 | 51.51 |
| Total Cash | 28,137.8 | 26,650.6 | 19,084.3 | 25,875.6 | 29,401.0 | 25,614.3 | 25,541.8 | 25,469.5 | 25,397.5 | 25,325.6 |
| Total Cash, percent | .0 | .0 | .0 | .0 | .0 | .0 | .0 | .0 | .0 | .0 |
| Account Receivables | 367.7 | 189.9 | 100.0 | 96.0 | 110.6 | 171.7 | 171.2 | 170.7 | 170.2 | 169.7 |
| Account Receivables, % | 1.26 | 0.6563 | 0.35253 | 0.33451 | 0.38423 | 0.59802 | 0.59802 | 0.59802 | 0.59802 | 0.59802 |
| Inventories | 4,047.3 | 3,981.1 | 4,095.9 | .0 | -130.8 | 2,390.6 | 2,383.8 | 2,377.0 | 2,370.3 | 2,363.6 |
| Inventories, % | 13.9 | 13.76 | 14.44 | 0 | -0.4545 | 8.33 | 8.33 | 8.33 | 8.33 | 8.33 |
| Accounts Payable | 1,673.0 | 813.8 | 1,514.2 | 1,287.0 | 916.1 | 1,237.9 | 1,234.4 | 1,230.9 | 1,227.4 | 1,223.9 |
| Accounts Payable, % | 5.74 | 2.81 | 5.34 | 4.48 | 3.18 | 4.31 | 4.31 | 4.31 | 4.31 | 4.31 |
| Capital Expenditure | -11,257.4 | -3,816.2 | -14,483.4 | -4,056.5 | -11,382.9 | -8,989.3 | -8,963.8 | -8,938.5 | -8,913.2 | -8,888.0 |
| Capital Expenditure, % | -38.66 | -13.19 | -51.06 | -14.14 | -39.54 | -31.32 | -31.32 | -31.32 | -31.32 | -31.32 |
| Tax Rate, % | 0.01317663 | 0.01317663 | 0.01317663 | 0.01317663 | 0.01317663 | 0.01317663 | 0.01317663 | 0.01317663 | 0.01317663 | 0.01317663 |
| EBITAT | 15,026.8 | 15,503.6 | 15,002.5 | 14,163.1 | 14,501.4 | 14,784.9 | 14,743.1 | 14,701.4 | 14,659.8 | 14,618.3 |
| Depreciation | ||||||||||
| Changes in Account Receivables | ||||||||||
| Changes in Inventories | ||||||||||
| Changes in Accounts Payable | ||||||||||
| Capital Expenditure | ||||||||||
| UFCF | 4,700.3 | 14,703.8 | 4,771.9 | 17,567.5 | 6,613.8 | 7,169.3 | 9,407.0 | 9,380.3 | 9,353.8 | 9,327.3 |
| WACC, % | 4.17 | 4.17 | 4.17 | 4.17 | 4.17 | 4.17 | 4.17 | 4.17 | 4.17 | 4.17 |
| PV UFCF | ||||||||||
| SUM PV UFCF | 39,399.0 | |||||||||
| Long Term Growth Rate, % | 3.00 | |||||||||
| Free cash flow (T + 1) | 9,607 | |||||||||
| Terminal Value | 822,278 | |||||||||
| Present Terminal Value | 670,409 | |||||||||
| Enterprise Value | 709,808 | |||||||||
| Net Debt | 189,998 | |||||||||
| Equity Value | 519,809 | |||||||||
| Diluted Shares Outstanding, MM | 1 | |||||||||
| Equity Value Per Share | 546,538.79 |
Benefits of Using Our Model
- Flexible Forecast Inputs: Modify key assumptions (growth %, margins, WACC) effortlessly to explore various scenarios.
- Real-Time Data: Financial information for Daiwa Office Investment Corporation (8976T) pre-loaded to facilitate your analysis.
- Instant DCF Calculations: The template automatically computes Net Present Value (NPV) and intrinsic value for your convenience.
- Tailored and Professional Design: A refined Excel model that meets your valuation requirements with ease.
- Designed for Analysts and Investors: Perfect for evaluating projections, confirming strategies, and optimizing your time.
Key Features
- Customizable Investment Metrics: Adjust essential variables such as rental income growth, operating expenses, and acquisition costs.
- Instant DCF Valuation: Quickly calculates intrinsic value, net present value (NPV), and other essential metrics.
- High Precision Accuracy: Leverages Daiwa Office Investment Corporation’s [8976T] actual financial data for reliable valuation insights.
- Effortless Scenario Analysis: Easily explore various assumptions and assess their impact on outcomes.
- Efficiency Booster: Avoid the complexity of constructing intricate valuation models from the ground up.
How It Works
- Step 1: Download the prebuilt Excel template featuring Daiwa Office Investment Corporation’s (8976T) data.
- Step 2: Review the pre-filled sheets to familiarize yourself with the essential metrics.
- Step 3: Adjust forecasts and assumptions within the editable yellow cells (WACC, growth, margins).
- Step 4: Instantly see the updated results, including Daiwa Office Investment Corporation’s intrinsic value.
- Step 5: Make well-informed investment decisions or create reports using the generated outputs.
Why Select This Calculator?
- User-Friendly and Accessible: Crafted for both novices and seasoned users.
- Customizable Inputs: Easily adjust parameters to suit your specific analysis.
- Immediate Feedback: Observe real-time fluctuations in Daiwa Office Investment Corporation’s valuation as you modify inputs.
- Pre-Loaded Data: Comes with Daiwa Office Investment Corporation’s (8976T) actual financial metrics for swift evaluations.
- Endorsed by Industry Experts: Preferred by investors and analysts for sound decision-making.
Who Should Utilize This Product?
- Investors: Assess the valuation of Daiwa Office Investment Corporation (8976T) before making buy or sell decisions.
- CFOs and Financial Analysts: Enhance valuation processes and evaluate financial projections.
- Startup Founders: Gain insights into how large real estate investment trusts like Daiwa Office Investment Corporation (8976T) are valued.
- Consultants: Provide clients with detailed and professional valuation reports.
- Students and Educators: Incorporate real-world examples to practice and teach valuation methodologies.
Contents of the Template
- Thorough DCF Model: Editable template featuring comprehensive valuation calculations.
- Real-World Data: Historical and projected financials of Daiwa Office Investment Corporation (8976T) preloaded for insightful analysis.
- Customizable Parameters: Modify WACC, growth rates, and tax assumptions to explore various scenarios.
- Financial Statements: Detailed annual and quarterly breakdowns for enhanced understanding.
- Key Ratios: Integrated analysis focusing on profitability, efficiency, and leverage metrics.
- Dashboard with Visual Outputs: Charts and tables designed to present clear, actionable insights.
Disclaimer
All information, articles, and product details provided on this website are for general informational and educational purposes only. We do not claim any ownership over, nor do we intend to infringe upon, any trademarks, copyrights, logos, brand names, or other intellectual property mentioned or depicted on this site. Such intellectual property remains the property of its respective owners, and any references here are made solely for identification or informational purposes, without implying any affiliation, endorsement, or partnership.
We make no representations or warranties, express or implied, regarding the accuracy, completeness, or suitability of any content or products presented. Nothing on this website should be construed as legal, tax, investment, financial, medical, or other professional advice. In addition, no part of this site—including articles or product references—constitutes a solicitation, recommendation, endorsement, advertisement, or offer to buy or sell any securities, franchises, or other financial instruments, particularly in jurisdictions where such activity would be unlawful.
All content is of a general nature and may not address the specific circumstances of any individual or entity. It is not a substitute for professional advice or services. Any actions you take based on the information provided here are strictly at your own risk. You accept full responsibility for any decisions or outcomes arising from your use of this website and agree to release us from any liability in connection with your use of, or reliance upon, the content or products found herein.