
|
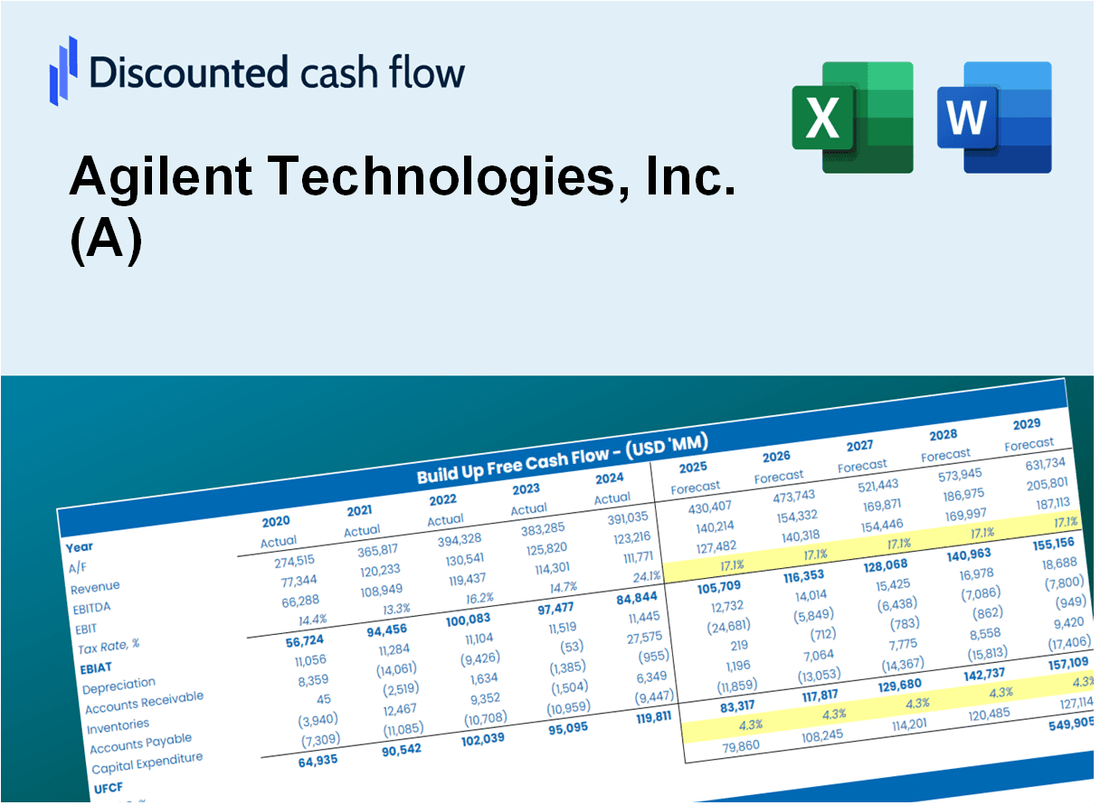
Agilent Technologies ، Inc. (A) DCF تقييم |
Fully Editable: Tailor To Your Needs In Excel Or Sheets
Professional Design: Trusted, Industry-Standard Templates
Investor-Approved Valuation Models
MAC/PC Compatible, Fully Unlocked
No Expertise Is Needed; Easy To Follow
Agilent Technologies, Inc. (A) Bundle
هل تبحث عن تحديد القيمة الجوهرية لشركة Agilent Technologies، Inc. ؟ تدمج حاسبة DCF (A) الخاصة بنا بيانات العالم الحقيقي مع ميزات تخصيص واسعة النطاق، مما يتيح لك تحسين توقعاتك وتعزيز قرارات الاستثمار الخاصة بك.
What You Will Get
- Real A (Agilent Technologies) Financials: Includes historical and forecasted data for accurate valuation.
- Adjustable Inputs: Modify WACC, tax rates, revenue growth, and capital expenditures.
- Automatic Calculations: Intrinsic value and NPV are calculated dynamically.
- Scenario Analysis: Test multiple scenarios to evaluate Agilent’s future performance.
- Clear and Intuitive Design: Built for professionals yet accessible for beginners.
Key Features
- 🔍 Real-Life A Agilent Financials: Pre-filled historical and projected data for Agilent Technologies, Inc. (A).
- ✏️ Fully Customizable Inputs: Adjust all critical parameters (yellow cells) like WACC, growth %, and tax rates.
- 📊 Professional DCF Valuation: Built-in formulas calculate Agilent’s intrinsic value using the Discounted Cash Flow method.
- ⚡ Instant Results: Visualize Agilent’s valuation instantly after making changes.
- Scenario Analysis: Test and compare outcomes for various financial assumptions side-by-side.
How It Works
- 1. Access the Template: Download and open the Excel file containing Agilent Technologies, Inc.'s (A) preloaded data.
- 2. Modify Assumptions: Adjust key variables such as growth rates, WACC, and capital expenditures.
- 3. View Results Instantly: The DCF model automatically calculates intrinsic value and NPV based on your inputs.
- 4. Explore Scenarios: Analyze various forecasts to evaluate different valuation outcomes.
- 5. Present with Confidence: Share professional valuation insights to bolster your decision-making process.
Why Choose Agilent Technologies, Inc. (A)?
- Innovative Solutions: Benefit from cutting-edge technology tailored for your analytical needs.
- Enhance Efficiency: Streamlined processes and products help you achieve results faster.
- Comprehensive Support: Access expert assistance and resources to maximize your investment.
- Data-Driven Insights: Leverage advanced analytics for informed decision-making.
- Industry Leader: Trusted by professionals worldwide for quality and reliability.
Who Should Use This Product?
- Professional Investors: Develop comprehensive and accurate valuation models for portfolio assessment of Agilent Technologies, Inc. (A).
- Corporate Finance Teams: Evaluate valuation scenarios to inform strategic decisions within their organizations.
- Consultants and Advisors: Deliver precise valuation insights to clients regarding Agilent Technologies, Inc. (A).
- Students and Educators: Utilize real-world data to enhance the learning and practice of financial modeling techniques.
- Tech Enthusiasts: Gain insights into the valuation processes of technology companies like Agilent Technologies, Inc. (A).
What the Template Contains
- Comprehensive DCF Model: Editable template with detailed valuation calculations tailored for Agilent Technologies, Inc. (A).
- Real-World Data: Agilent’s historical and projected financials preloaded for in-depth analysis.
- Customizable Parameters: Adjust WACC, growth rates, and tax assumptions to explore various scenarios.
- Financial Statements: Complete annual and quarterly breakdowns for enhanced insights.
- Key Ratios: Integrated analysis for profitability, efficiency, and leverage metrics.
- Dashboard with Visual Outputs: Charts and tables for clear, actionable results specific to Agilent Technologies, Inc. (A).
Disclaimer
All information, articles, and product details provided on this website are for general informational and educational purposes only. We do not claim any ownership over, nor do we intend to infringe upon, any trademarks, copyrights, logos, brand names, or other intellectual property mentioned or depicted on this site. Such intellectual property remains the property of its respective owners, and any references here are made solely for identification or informational purposes, without implying any affiliation, endorsement, or partnership.
We make no representations or warranties, express or implied, regarding the accuracy, completeness, or suitability of any content or products presented. Nothing on this website should be construed as legal, tax, investment, financial, medical, or other professional advice. In addition, no part of this site—including articles or product references—constitutes a solicitation, recommendation, endorsement, advertisement, or offer to buy or sell any securities, franchises, or other financial instruments, particularly in jurisdictions where such activity would be unlawful.
All content is of a general nature and may not address the specific circumstances of any individual or entity. It is not a substitute for professional advice or services. Any actions you take based on the information provided here are strictly at your own risk. You accept full responsibility for any decisions or outcomes arising from your use of this website and agree to release us from any liability in connection with your use of, or reliance upon, the content or products found herein.