
|
تقييم ANUP Engineering Limited (anup.ns) DCF |
Fully Editable: Tailor To Your Needs In Excel Or Sheets
Professional Design: Trusted, Industry-Standard Templates
Investor-Approved Valuation Models
MAC/PC Compatible, Fully Unlocked
No Expertise Is Needed; Easy To Follow
The Anup Engineering Limited (ANUP.NS) Bundle
عزز خيارات الاستثمار الخاصة بك مع حاسبة (anupns) DCF! استكشاف البيانات المالية الحقيقية من ANUP Engineering Limited ، وضبط توقعات النمو والنفقات ، ولاحظ كيف تؤثر هذه التعديلات على الفور على القيمة الجوهرية لـ (ANUPNs).
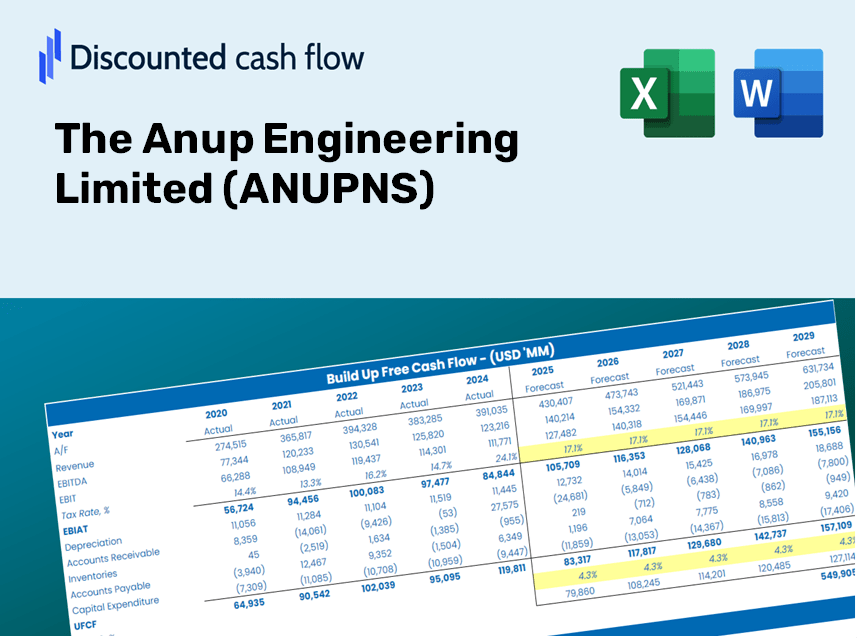
Discounted Cash Flow (DCF) - (USD MM)
| Year | AY1 2021 |
AY2 2022 |
AY3 2023 |
AY4 2024 |
AY5 2025 |
FY1 2026 |
FY2 2027 |
FY3 2028 |
FY4 2029 |
FY5 2030 |
|---|---|---|---|---|---|---|---|---|---|---|
| Revenue | 2,762.5 | 2,867.8 | 4,113.4 | 5,460.7 | 7,327.9 | 9,419.8 | 12,109.0 | 15,565.9 | 20,009.6 | 25,722.0 |
| Revenue Growth, % | 0 | 3.81 | 43.43 | 32.75 | 34.19 | 28.55 | 28.55 | 28.55 | 28.55 | 28.55 |
| EBITDA | 731.8 | 736.0 | 826.2 | 1,354.1 | 1,652.2 | 2,252.9 | 2,896.0 | 3,722.8 | 4,785.6 | 6,151.8 |
| EBITDA, % | 26.49 | 25.66 | 20.09 | 24.8 | 22.55 | 23.92 | 23.92 | 23.92 | 23.92 | 23.92 |
| Depreciation | 105.1 | 115.9 | 125.4 | 174.6 | 238.2 | 326.7 | 420.0 | 539.9 | 694.0 | 892.2 |
| Depreciation, % | 3.8 | 4.04 | 3.05 | 3.2 | 3.25 | 3.47 | 3.47 | 3.47 | 3.47 | 3.47 |
| EBIT | 626.7 | 620.0 | 700.8 | 1,179.4 | 1,414.1 | 1,926.2 | 2,476.0 | 3,182.9 | 4,091.6 | 5,259.6 |
| EBIT, % | 22.69 | 21.62 | 17.04 | 21.6 | 19.3 | 20.45 | 20.45 | 20.45 | 20.45 | 20.45 |
| Total Cash | 208.7 | 498.9 | 310.9 | 1,216.1 | 263.1 | 1,099.6 | 1,413.6 | 1,817.1 | 2,335.8 | 3,002.7 |
| Total Cash, percent | .0 | .0 | .0 | .0 | .0 | .0 | .0 | .0 | .0 | .0 |
| Account Receivables | 1,120.4 | 1,265.0 | 1,490.6 | 1,303.0 | 2,849.2 | 3,459.9 | 4,447.6 | 5,717.3 | 7,349.5 | 9,447.6 |
| Account Receivables, % | 40.56 | 44.11 | 36.24 | 23.86 | 38.88 | 36.73 | 36.73 | 36.73 | 36.73 | 36.73 |
| Inventories | 667.8 | 902.0 | 1,269.2 | 1,652.8 | 1,472.9 | 2,578.2 | 3,314.2 | 4,260.3 | 5,476.6 | 7,040.0 |
| Inventories, % | 24.17 | 31.45 | 30.86 | 30.27 | 20.1 | 27.37 | 27.37 | 27.37 | 27.37 | 27.37 |
| Accounts Payable | 269.5 | 433.0 | 658.3 | 629.2 | 884.1 | 1,214.0 | 1,560.6 | 2,006.2 | 2,578.9 | 3,315.1 |
| Accounts Payable, % | 9.75 | 15.1 | 16 | 11.52 | 12.07 | 12.89 | 12.89 | 12.89 | 12.89 | 12.89 |
| Capital Expenditure | -402.8 | -415.5 | -749.2 | -429.1 | -446.2 | -1,153.6 | -1,482.9 | -1,906.2 | -2,450.4 | -3,150.0 |
| Capital Expenditure, % | -14.58 | -14.49 | -18.21 | -7.86 | -6.09 | -12.25 | -12.25 | -12.25 | -12.25 | -12.25 |
| Tax Rate, % | 17.39 | 17.39 | 17.39 | 17.39 | 17.39 | 17.39 | 17.39 | 17.39 | 17.39 | 17.39 |
| EBITAT | 545.7 | 629.5 | 514.9 | 1,050.5 | 1,168.2 | 1,665.1 | 2,140.5 | 2,751.5 | 3,537.0 | 4,546.8 |
| Depreciation | ||||||||||
| Changes in Account Receivables | ||||||||||
| Changes in Inventories | ||||||||||
| Changes in Accounts Payable | ||||||||||
| Capital Expenditure | ||||||||||
| UFCF | -1,270.8 | 114.7 | -476.4 | 570.9 | -151.2 | -547.7 | -299.6 | -385.1 | -495.1 | -636.4 |
| WACC, % | 4.56 | 4.57 | 4.55 | 4.57 | 4.56 | 4.56 | 4.56 | 4.56 | 4.56 | 4.56 |
| PV UFCF | ||||||||||
| SUM PV UFCF | -2,057.9 | |||||||||
| Long Term Growth Rate, % | 4.00 | |||||||||
| Free cash flow (T + 1) | -662 | |||||||||
| Terminal Value | -117,462 | |||||||||
| Present Terminal Value | -93,972 | |||||||||
| Enterprise Value | -96,030 | |||||||||
| Net Debt | 167 | |||||||||
| Equity Value | -96,197 | |||||||||
| Diluted Shares Outstanding, MM | 20 | |||||||||
| Equity Value Per Share | -4,800.75 |
ما ستكسبه
- مدخلات التنبؤ المرنة: تعديل الافتراضات الرئيسية (النمو٪، الهوامش، WACC) دون عناء لاستكشاف سيناريوهات مختلفة.
- البيانات المالية الفعلية: معلومات مالية مملوءة مسبقًا لشركة Anup Engineering Limited (ANUPNS) لبدء تحليلك.
- حسابات DCF الآلية: يحسب القالب تلقائيًا صافي القيمة الحالية (NPV) والقيمة الجوهرية بالنسبة لك.
- قابل للتخصيص وأنيق: نموذج Excel مكرر مصمم لتلبية متطلبات التقييم الخاصة بك.
- صُنعت للمحللين والمستثمرين: مثالي لاختبار التنبؤات والتحقق من صحة الاستراتيجيات وتعزيز الكفاءة.
الميزات الرئيسية
- بيانات شاملة: الوصول إلى البيانات المالية التاريخية لـ Anup Engineering Limited (ANUPNS) والتوقعات المليئة مسبقًا.
- مدخلات قابلة للتخصيص: اضبط WACC ، ومعدلات الضرائب ، ونمو الإيرادات ، وهامش الأرباح قبل الفوائد والضرائب والإهلاك والاستهلاك لتناسب تحليلك.
- نتائج الوقت الحقيقي: راقب إعادة حساب القيمة الجوهرية في ANUP Engineering Limited (ANUPNS) على الفور.
- صور بديهية: تقدم مخططات لوحة القيادة نتائج التقييم والمقاييس الأساسية بوضوح.
- مصمم للدقة: أداة احترافية من الدرجة المهنية مصممة للمحللين والمستثمرين والمهنيين الماليين.
كيف تعمل
- 1. الوصول إلى القالب: قم بتنزيل وفتح ملف Excel الذي يحتوي على بيانات ANUP Engineering Limited المسبقة (ANUPNS).
- 2. تعديل الافتراضات: ضبط المتغيرات الأساسية مثل معدلات النمو ، WACC ، والنفقات الرأسمالية.
- 3. انظر النتائج في الوقت الفعلي: يقوم نموذج DCF تلقائيًا بحساب القيمة الجوهرية و NPV.
- 4. استكشاف السيناريوهات: تقييم التنبؤات المختلفة لتقييم نتائج التقييم المختلفة.
- 5. الاستفادة من ضمان: مشاركة رؤى التقييم المهنية لدعم قراراتك.
لماذا اختر حاسبة Anup Engineering Limited (ANUPNS) ؟
- كفاءة الوقت: تخطي متاعب بناء نموذج DCF من الألف إلى الياء - كل شيء جاهز لك.
- تحسين الدقة: تقلل البيانات والصيغ المالية الدقيقة من التباينات في التقييم.
- قابل للتخصيص تمامًا: قم بتعديل النموذج ليناسب افتراضاتك وتوقعاتك المحددة.
- سهل الاستخدام: فالخرائط والنواتج البديهية تبسط تحليل النتائج.
- يفضله الفنيون: صُنع للخبراء الذين يعطون الأولوية للدقة والوظائف.
من يجب أن يستخدم هذا المنتج ؟
- المستثمرون الأفراد: اكتسب رؤى لاتخاذ قرارات مستنيرة بشأن شراء أو بيع أسهم Anup Engineering Limited (ANUPNS).
- المحللون الماليون: تعزيز أساليب التقييم باستخدام نماذج مالية شاملة مصممة خصيصًا لشركة Anup Engineering Limited (ANUPNS).
- الخبراء الاستشاريون: تزويد العملاء بتحليلات تقييم دقيقة وفي الوقت المناسب تتعلق بشركة Anup Engineering Limited (ANUPNS).
- أصحاب الأعمال: تعرف على مبادئ التقييم للشركات الكبرى مثل Anup Engineering Limited (ANUPNS) لتحسين استراتيجيات عملك الخاصة.
- طلاب التمويل: اكتساب مهارات تقييم عملية باستخدام بيانات حقيقية ودراسات حالة من Anup Engineering Limited (ANUPNS).
محتويات القالب
- البيانات التاريخية: يحتوي على البيانات المالية السابقة لـ Anup Engineering Limited والتوقعات التأسيسية.
- نماذج DCF و Ruvered DCF: قوالب شاملة مصممة لتحديد القيمة الجوهرية لـ ANUP Engineering Limited (ANUPNS).
- ورقة WACC: الحسابات المُخطط مسبقًا لمتوسط تكلفة رأس المال المرجح.
- مدخلات قابلة للتحرير: تخصيص برامج التشغيل الأساسية مثل معدلات النمو ، EBITDA ٪ ، وافتراضات Capex.
- البيانات الفصلية والسنوية: تحليل شامل للأداء المالي لـ Anup Engineering Limited.
- لوحة القيادة التفاعلية: تصور ديناميكيا نتائج التقييم والتوقعات.
Disclaimer
All information, articles, and product details provided on this website are for general informational and educational purposes only. We do not claim any ownership over, nor do we intend to infringe upon, any trademarks, copyrights, logos, brand names, or other intellectual property mentioned or depicted on this site. Such intellectual property remains the property of its respective owners, and any references here are made solely for identification or informational purposes, without implying any affiliation, endorsement, or partnership.
We make no representations or warranties, express or implied, regarding the accuracy, completeness, or suitability of any content or products presented. Nothing on this website should be construed as legal, tax, investment, financial, medical, or other professional advice. In addition, no part of this site—including articles or product references—constitutes a solicitation, recommendation, endorsement, advertisement, or offer to buy or sell any securities, franchises, or other financial instruments, particularly in jurisdictions where such activity would be unlawful.
All content is of a general nature and may not address the specific circumstances of any individual or entity. It is not a substitute for professional advice or services. Any actions you take based on the information provided here are strictly at your own risk. You accept full responsibility for any decisions or outcomes arising from your use of this website and agree to release us from any liability in connection with your use of, or reliance upon, the content or products found herein.