
|
La valoración de DCF de ANUP Engineering Limited (ANUP.NS) |
Completamente Editable: Adáptelo A Sus Necesidades En Excel O Sheets
Diseño Profesional: Plantillas Confiables Y Estándares De La Industria
Predeterminadas Para Un Uso Rápido Y Eficiente
Compatible con MAC / PC, completamente desbloqueado
No Se Necesita Experiencia; Fáciles De Seguir
The Anup Engineering Limited (ANUP.NS) Bundle
¡Mejore sus opciones de inversión con la calculadora DCF (anupns)! Explore los datos financieros genuinos del ANUP Engineering Limited, ajuste las proyecciones y gastos de crecimiento, y observe cómo estas modificaciones afectan instantáneamente el valor intrínseco de (ANUPN).
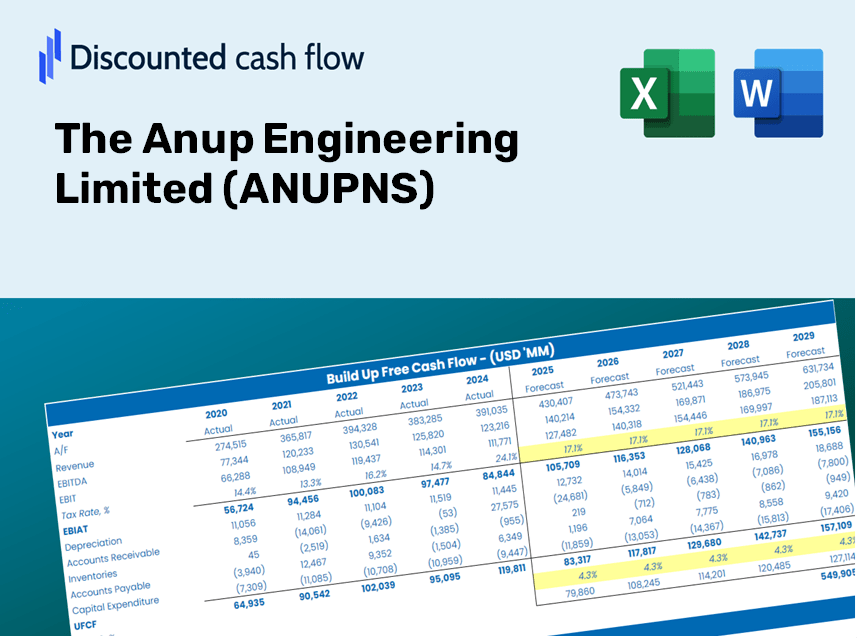
Discounted Cash Flow (DCF) - (USD MM)
| Year | AY1 2021 |
AY2 2022 |
AY3 2023 |
AY4 2024 |
AY5 2025 |
FY1 2026 |
FY2 2027 |
FY3 2028 |
FY4 2029 |
FY5 2030 |
|---|---|---|---|---|---|---|---|---|---|---|
| Revenue | 2,762.5 | 2,867.8 | 4,113.4 | 5,460.7 | 7,327.9 | 9,419.8 | 12,109.0 | 15,565.9 | 20,009.6 | 25,722.0 |
| Revenue Growth, % | 0 | 3.81 | 43.43 | 32.75 | 34.19 | 28.55 | 28.55 | 28.55 | 28.55 | 28.55 |
| EBITDA | 731.8 | 736.0 | 826.2 | 1,354.1 | 1,652.2 | 2,252.9 | 2,896.0 | 3,722.8 | 4,785.6 | 6,151.8 |
| EBITDA, % | 26.49 | 25.66 | 20.09 | 24.8 | 22.55 | 23.92 | 23.92 | 23.92 | 23.92 | 23.92 |
| Depreciation | 105.1 | 115.9 | 125.4 | 174.6 | 238.2 | 326.7 | 420.0 | 539.9 | 694.0 | 892.2 |
| Depreciation, % | 3.8 | 4.04 | 3.05 | 3.2 | 3.25 | 3.47 | 3.47 | 3.47 | 3.47 | 3.47 |
| EBIT | 626.7 | 620.0 | 700.8 | 1,179.4 | 1,414.1 | 1,926.2 | 2,476.0 | 3,182.9 | 4,091.6 | 5,259.6 |
| EBIT, % | 22.69 | 21.62 | 17.04 | 21.6 | 19.3 | 20.45 | 20.45 | 20.45 | 20.45 | 20.45 |
| Total Cash | 208.7 | 498.9 | 310.9 | 1,216.1 | 263.1 | 1,099.6 | 1,413.6 | 1,817.1 | 2,335.8 | 3,002.7 |
| Total Cash, percent | .0 | .0 | .0 | .0 | .0 | .0 | .0 | .0 | .0 | .0 |
| Account Receivables | 1,120.4 | 1,265.0 | 1,490.6 | 1,303.0 | 2,849.2 | 3,459.9 | 4,447.6 | 5,717.3 | 7,349.5 | 9,447.6 |
| Account Receivables, % | 40.56 | 44.11 | 36.24 | 23.86 | 38.88 | 36.73 | 36.73 | 36.73 | 36.73 | 36.73 |
| Inventories | 667.8 | 902.0 | 1,269.2 | 1,652.8 | 1,472.9 | 2,578.2 | 3,314.2 | 4,260.3 | 5,476.6 | 7,040.0 |
| Inventories, % | 24.17 | 31.45 | 30.86 | 30.27 | 20.1 | 27.37 | 27.37 | 27.37 | 27.37 | 27.37 |
| Accounts Payable | 269.5 | 433.0 | 658.3 | 629.2 | 884.1 | 1,214.0 | 1,560.6 | 2,006.2 | 2,578.9 | 3,315.1 |
| Accounts Payable, % | 9.75 | 15.1 | 16 | 11.52 | 12.07 | 12.89 | 12.89 | 12.89 | 12.89 | 12.89 |
| Capital Expenditure | -402.8 | -415.5 | -749.2 | -429.1 | -446.2 | -1,153.6 | -1,482.9 | -1,906.2 | -2,450.4 | -3,150.0 |
| Capital Expenditure, % | -14.58 | -14.49 | -18.21 | -7.86 | -6.09 | -12.25 | -12.25 | -12.25 | -12.25 | -12.25 |
| Tax Rate, % | 17.39 | 17.39 | 17.39 | 17.39 | 17.39 | 17.39 | 17.39 | 17.39 | 17.39 | 17.39 |
| EBITAT | 545.7 | 629.5 | 514.9 | 1,050.5 | 1,168.2 | 1,665.1 | 2,140.5 | 2,751.5 | 3,537.0 | 4,546.8 |
| Depreciation | ||||||||||
| Changes in Account Receivables | ||||||||||
| Changes in Inventories | ||||||||||
| Changes in Accounts Payable | ||||||||||
| Capital Expenditure | ||||||||||
| UFCF | -1,270.8 | 114.7 | -476.4 | 570.9 | -151.2 | -547.7 | -299.6 | -385.1 | -495.1 | -636.4 |
| WACC, % | 4.56 | 4.57 | 4.55 | 4.57 | 4.56 | 4.56 | 4.56 | 4.56 | 4.56 | 4.56 |
| PV UFCF | ||||||||||
| SUM PV UFCF | -2,057.9 | |||||||||
| Long Term Growth Rate, % | 4.00 | |||||||||
| Free cash flow (T + 1) | -662 | |||||||||
| Terminal Value | -117,462 | |||||||||
| Present Terminal Value | -93,972 | |||||||||
| Enterprise Value | -96,030 | |||||||||
| Net Debt | 167 | |||||||||
| Equity Value | -96,197 | |||||||||
| Diluted Shares Outstanding, MM | 20 | |||||||||
| Equity Value Per Share | -4,800.75 |
What You Will Gain
- Flexible Forecast Inputs: Modify key assumptions (growth %, margins, WACC) effortlessly to explore various scenarios.
- Actual Financial Data: Pre-filled financial information for The Anup Engineering Limited (ANUPNS) to kickstart your analysis.
- Automated DCF Calculations: The template automatically computes Net Present Value (NPV) and intrinsic value for you.
- Customizable and Sleek: A refined Excel model designed to meet your valuation requirements.
- Crafted for Analysts and Investors: Perfect for testing forecasts, validating strategies, and enhancing efficiency.
Key Features
- Comprehensive Data: Access The Anup Engineering Limited’s (ANUPNS) historical financial statements and pre-filled forecasts.
- Customizable Inputs: Adjust WACC, tax rates, revenue growth, and EBITDA margins to fit your analysis.
- Real-Time Results: Observe the recalculation of The Anup Engineering Limited’s (ANUPNS) intrinsic value instantly.
- Intuitive Visuals: Dashboard charts present valuation outcomes and essential metrics clearly.
- Designed for Precision: A professional-grade tool tailored for analysts, investors, and finance professionals.
How It Functions
- 1. Access the Template: Download and open the Excel file containing The Anup Engineering Limited's preloaded data (ANUPNS).
- 2. Modify Assumptions: Adjust essential variables such as growth rates, WACC, and capital expenditures.
- 3. See Results in Real-Time: The DCF model automatically computes intrinsic value and NPV.
- 4. Explore Scenarios: Evaluate various forecasts to assess different valuation outcomes.
- 5. Utilize with Assurance: Share professional valuation insights to back your decisions.
Why Choose The Anup Engineering Limited (ANUPNS) Calculator?
- Time-Efficient: Skip the hassle of building a DCF model from the ground up – it’s all set for you.
- Enhanced Precision: Accurate financial data and formulas minimize valuation discrepancies.
- Completely Customizable: Adjust the model to suit your specific assumptions and forecasts.
- User-Friendly: Intuitive charts and outputs simplify the analysis of results.
- Preferred by Professionals: Crafted for experts who prioritize accuracy and functionality.
Who Should Use This Product?
- Individual Investors: Gain insights to make informed decisions regarding buying or selling Anup Engineering Limited (ANUPNS) stock.
- Financial Analysts: Enhance valuation methods with comprehensive financial models tailored for Anup Engineering Limited (ANUPNS).
- Consultants: Provide clients with accurate and timely valuation analyses related to Anup Engineering Limited (ANUPNS).
- Business Owners: Learn the valuation principles of major firms like Anup Engineering Limited (ANUPNS) to refine your own business strategies.
- Finance Students: Acquire practical valuation skills utilizing real data and case studies from Anup Engineering Limited (ANUPNS).
Contents of the Template
- Historical Data: Contains The Anup Engineering Limited's past financials and foundational forecasts.
- DCF and Levered DCF Models: Comprehensive templates designed to determine the intrinsic value of The Anup Engineering Limited (ANUPNS).
- WACC Sheet: Pre-formulated calculations for the Weighted Average Cost of Capital.
- Editable Inputs: Customize essential drivers such as growth rates, EBITDA %, and CAPEX assumptions.
- Quarterly and Annual Statements: Thorough analysis of The Anup Engineering Limited's financial performance.
- Interactive Dashboard: Dynamically visualize valuation outcomes and forecasts.
Disclaimer
All information, articles, and product details provided on this website are for general informational and educational purposes only. We do not claim any ownership over, nor do we intend to infringe upon, any trademarks, copyrights, logos, brand names, or other intellectual property mentioned or depicted on this site. Such intellectual property remains the property of its respective owners, and any references here are made solely for identification or informational purposes, without implying any affiliation, endorsement, or partnership.
We make no representations or warranties, express or implied, regarding the accuracy, completeness, or suitability of any content or products presented. Nothing on this website should be construed as legal, tax, investment, financial, medical, or other professional advice. In addition, no part of this site—including articles or product references—constitutes a solicitation, recommendation, endorsement, advertisement, or offer to buy or sell any securities, franchises, or other financial instruments, particularly in jurisdictions where such activity would be unlawful.
All content is of a general nature and may not address the specific circumstances of any individual or entity. It is not a substitute for professional advice or services. Any actions you take based on the information provided here are strictly at your own risk. You accept full responsibility for any decisions or outcomes arising from your use of this website and agree to release us from any liability in connection with your use of, or reliance upon, the content or products found herein.