
|
تقييم Ames National Corporation (ATLO) DCF |
Fully Editable: Tailor To Your Needs In Excel Or Sheets
Professional Design: Trusted, Industry-Standard Templates
Investor-Approved Valuation Models
MAC/PC Compatible, Fully Unlocked
No Expertise Is Needed; Easy To Follow
Ames National Corporation (ATLO) Bundle
استكشف التوقعات المالية لشركة Ames National Corporation (ATLO) مع حاسبة DCF سهلة الاستخدام! أدخل افتراضاتك المتعلقة بالنمو والهوامش والتكاليف لحساب القيمة الجوهرية لشركة Ames National Corporation (ATLO) وتشكيل استراتيجية الاستثمار الخاصة بك.
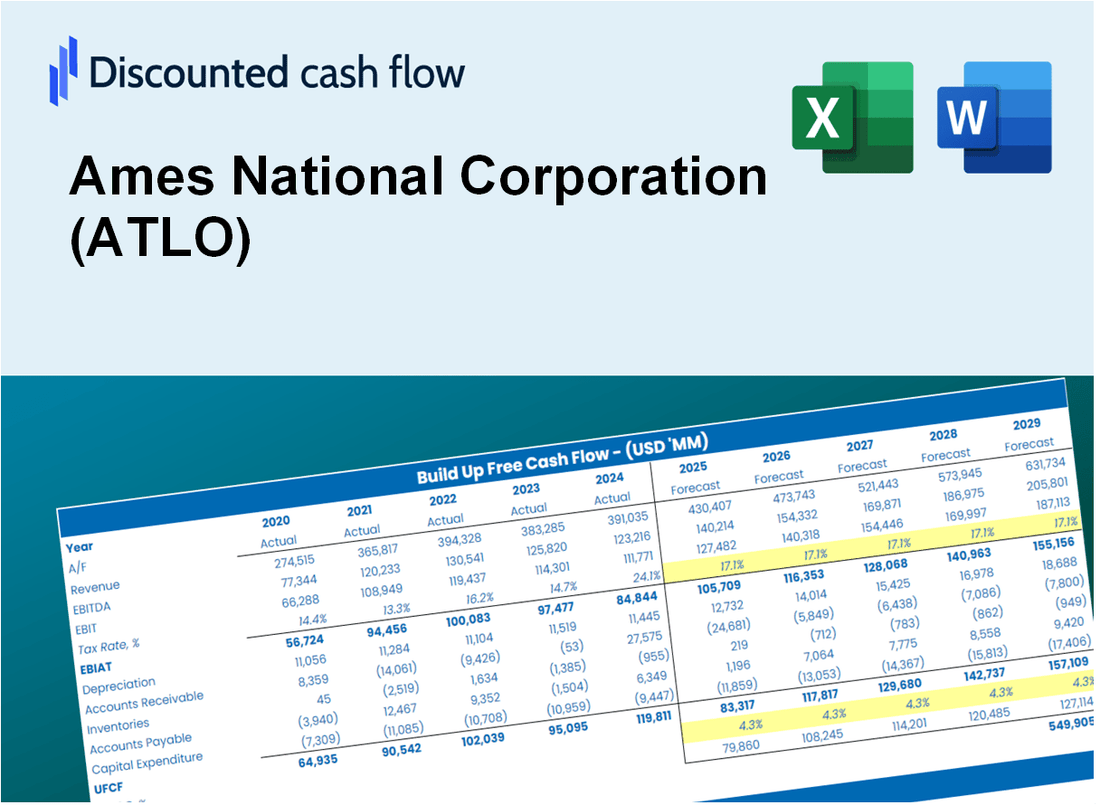
Discounted Cash Flow (DCF) - (USD MM)
| Year | AY1 2020 |
AY2 2021 |
AY3 2022 |
AY4 2023 |
AY5 2024 |
FY1 2025 |
FY2 2026 |
FY3 2027 |
FY4 2028 |
FY5 2029 |
|---|---|---|---|---|---|---|---|---|---|---|
| Revenue | 73.6 | 71.0 | 71.2 | 83.5 | 92.4 | 98.2 | 104.3 | 110.7 | 117.6 | 124.8 |
| Revenue Growth, % | 0 | -3.46 | 0.31118 | 17.23 | 10.69 | 6.19 | 6.19 | 6.19 | 6.19 | 6.19 |
| EBITDA | 25.5 | 32.7 | 27.2 | 14.6 | 13.9 | 29.7 | 31.6 | 33.5 | 35.6 | 37.8 |
| EBITDA, % | 34.67 | 46.04 | 38.12 | 17.53 | 15.07 | 30.29 | 30.29 | 30.29 | 30.29 | 30.29 |
| Depreciation | 2.3 | 2.0 | 2.0 | 1.8 | 1.7 | 2.5 | 2.6 | 2.8 | 3.0 | 3.2 |
| Depreciation, % | 3.09 | 2.85 | 2.8 | 2.1 | 1.83 | 2.54 | 2.54 | 2.54 | 2.54 | 2.54 |
| EBIT | 23.2 | 30.7 | 25.2 | 12.9 | 12.2 | 27.2 | 28.9 | 30.7 | 32.6 | 34.6 |
| EBIT, % | 31.58 | 43.19 | 35.32 | 15.43 | 13.24 | 27.75 | 27.75 | 27.75 | 27.75 | 27.75 |
| Total Cash | 788.5 | 937.1 | 829.0 | 800.4 | 302.2 | 98.2 | 104.3 | 110.7 | 117.6 | 124.8 |
| Total Cash, percent | .0 | .0 | .0 | .0 | .0 | .0 | .0 | .0 | .0 | .0 |
| Account Receivables | 11.1 | 10.1 | 11.3 | 13.0 | 13.9 | 14.9 | 15.8 | 16.8 | 17.8 | 18.9 |
| Account Receivables, % | 15.15 | 14.26 | 15.83 | 15.51 | 15 | 15.15 | 15.15 | 15.15 | 15.15 | 15.15 |
| Inventories | .0 | .0 | .0 | .0 | .0 | .0 | .0 | .0 | .0 | .0 |
| Inventories, % | 0 | 0 | 0 | 0 | 0 | 0 | 0 | 0 | 0 | 0 |
| Accounts Payable | .0 | .0 | .7 | 4.7 | 3.2 | 2.0 | 2.1 | 2.2 | 2.4 | 2.5 |
| Accounts Payable, % | 0 | 0 | 0.93487 | 5.64 | 3.47 | 2.01 | 2.01 | 2.01 | 2.01 | 2.01 |
| Capital Expenditure | -1.2 | -1.9 | -2.9 | -4.9 | -.3 | -2.9 | -3.0 | -3.2 | -3.4 | -3.6 |
| Capital Expenditure, % | -1.7 | -2.64 | -4.01 | -5.86 | -0.32236 | -2.91 | -2.91 | -2.91 | -2.91 | -2.91 |
| Tax Rate, % | 16.53 | 16.53 | 16.53 | 16.53 | 16.53 | 16.53 | 16.53 | 16.53 | 16.53 | 16.53 |
| EBITAT | 18.9 | 23.9 | 19.3 | 10.8 | 10.2 | 22.0 | 23.3 | 24.8 | 26.3 | 27.9 |
| Depreciation | ||||||||||
| Changes in Account Receivables | ||||||||||
| Changes in Inventories | ||||||||||
| Changes in Accounts Payable | ||||||||||
| Capital Expenditure | ||||||||||
| UFCF | 8.7 | 25.1 | 17.9 | 10.0 | 9.2 | 19.4 | 22.1 | 23.5 | 25.0 | 26.5 |
| WACC, % | 14.25 | 13.84 | 13.67 | 14.61 | 14.55 | 14.18 | 14.18 | 14.18 | 14.18 | 14.18 |
| PV UFCF | ||||||||||
| SUM PV UFCF | 78.1 | |||||||||
| Long Term Growth Rate, % | 2.00 | |||||||||
| Free cash flow (T + 1) | 27 | |||||||||
| Terminal Value | 222 | |||||||||
| Present Terminal Value | 114 | |||||||||
| Enterprise Value | 193 | |||||||||
| Net Debt | -8 | |||||||||
| Equity Value | 201 | |||||||||
| Diluted Shares Outstanding, MM | 9 | |||||||||
| Equity Value Per Share | 22.31 |
What You Will Get
- Real Ames National Data: Preloaded financials – from revenue to EBIT – based on actual and projected figures for Ames National Corporation (ATLO).
- Full Customization: Adjust all critical parameters (yellow cells) like WACC, growth %, and tax rates to fit your analysis.
- Instant Valuation Updates: Automatic recalculations to assess the impact of changes on Ames National’s fair value.
- Versatile Excel Template: Designed for quick edits, scenario testing, and comprehensive projections specific to Ames National Corporation (ATLO).
- Time-Saving and Accurate: Eliminate the need to build models from scratch while ensuring precision and adaptability.
Key Features
- Customizable Financial Inputs: Adjust essential parameters such as loan growth, interest rates, and operating expenses.
- Instant DCF Valuation: Automatically computes intrinsic value, NPV, and additional financial metrics.
- High Precision Accuracy: Leverages Ames National Corporation's (ATLO) actual financial data for credible valuation results.
- Effortless Scenario Testing: Easily explore various assumptions and analyze the resulting impacts.
- Efficiency Booster: Remove the hassle of constructing intricate valuation models from the ground up.
How It Works
- Step 1: Download the Excel file.
- Step 2: Review pre-entered Ames National Corporation (ATLO) data (historical and projected).
- Step 3: Adjust key assumptions (yellow cells) based on your analysis.
- Step 4: View automatic recalculations for Ames National Corporation’s intrinsic value.
- Step 5: Use the outputs for investment decisions or reporting.
Why Choose Ames National Corporation (ATLO)?
- Strong Financial Performance: Consistent growth and profitability make ATLO a reliable investment.
- Community Focused: Committed to supporting local communities and fostering relationships.
- Experienced Leadership: A seasoned management team with a proven track record in the banking industry.
- Innovative Services: Offering a range of financial products tailored to meet diverse customer needs.
- Reputation for Trust: Recognized for integrity and transparency in all business dealings.
Who Should Use Ames National Corporation (ATLO)?
- Finance Students: Explore banking principles and apply them to real-world scenarios.
- Academics: Utilize industry-specific models in your research or teaching materials.
- Investors: Evaluate your investment strategies and analyze financial metrics for Ames National Corporation (ATLO).
- Analysts: Enhance your analysis process with a tailored financial model for banking institutions.
- Small Business Owners: Understand how regional banks like Ames National Corporation (ATLO) operate and are assessed.
What the Template Contains
- Pre-Filled Data: Includes Ames National Corporation’s historical financials and forecasts.
- Discounted Cash Flow Model: Editable DCF valuation model with automatic calculations.
- Weighted Average Cost of Capital (WACC): A dedicated sheet for calculating WACC based on custom inputs.
- Key Financial Ratios: Analyze Ames National Corporation’s profitability, efficiency, and leverage.
- Customizable Inputs: Edit revenue growth, margins, and tax rates with ease.
- Clear Dashboard: Charts and tables summarizing key valuation results.
Disclaimer
All information, articles, and product details provided on this website are for general informational and educational purposes only. We do not claim any ownership over, nor do we intend to infringe upon, any trademarks, copyrights, logos, brand names, or other intellectual property mentioned or depicted on this site. Such intellectual property remains the property of its respective owners, and any references here are made solely for identification or informational purposes, without implying any affiliation, endorsement, or partnership.
We make no representations or warranties, express or implied, regarding the accuracy, completeness, or suitability of any content or products presented. Nothing on this website should be construed as legal, tax, investment, financial, medical, or other professional advice. In addition, no part of this site—including articles or product references—constitutes a solicitation, recommendation, endorsement, advertisement, or offer to buy or sell any securities, franchises, or other financial instruments, particularly in jurisdictions where such activity would be unlawful.
All content is of a general nature and may not address the specific circumstances of any individual or entity. It is not a substitute for professional advice or services. Any actions you take based on the information provided here are strictly at your own risk. You accept full responsibility for any decisions or outcomes arising from your use of this website and agree to release us from any liability in connection with your use of, or reliance upon, the content or products found herein.