
|
Credicorp Ltd. (BAP) تقييم DCF |
Fully Editable: Tailor To Your Needs In Excel Or Sheets
Professional Design: Trusted, Industry-Standard Templates
Investor-Approved Valuation Models
MAC/PC Compatible, Fully Unlocked
No Expertise Is Needed; Easy To Follow
Credicorp Ltd. (BAP) Bundle
عزز استراتيجيات الاستثمار الخاصة بك مع حاسبة Credicorp Ltd. (BAP) DCF! الاستفادة من البيانات المالية الحقيقية Credicorp ، وضبط توقعات النمو والنفقات ، ولاحظ على الفور كيفية تأثير التعديلات على القيمة الجوهرية لـ Credicorp Ltd. (BAP).
Discounted Cash Flow (DCF) - (USD MM)
| Year | AY1 2020 |
AY2 2021 |
AY3 2022 |
AY4 2023 |
AY5 2024 |
FY1 2025 |
FY2 2026 |
FY3 2027 |
FY4 2028 |
FY5 2029 |
|---|---|---|---|---|---|---|---|---|---|---|
| Revenue | 5,407.5 | 5,705.1 | 6,122.4 | 7,531.7 | 8,013.7 | 8,859.8 | 9,795.3 | 10,829.6 | 11,973.1 | 13,237.4 |
| Revenue Growth, % | 0 | 5.5 | 7.32 | 23.02 | 6.4 | 10.56 | 10.56 | 10.56 | 10.56 | 10.56 |
| EBITDA | 267.5 | 1,788.0 | 2,230.5 | 2,230.9 | 2,537.1 | 2,374.4 | 2,625.1 | 2,902.3 | 3,208.8 | 3,547.6 |
| EBITDA, % | 4.95 | 31.34 | 36.43 | 29.62 | 31.66 | 26.8 | 26.8 | 26.8 | 26.8 | 26.8 |
| Depreciation | 200.9 | 205.0 | 191.0 | 198.0 | 214.5 | 278.8 | 308.3 | 340.8 | 376.8 | 416.6 |
| Depreciation, % | 3.72 | 3.59 | 3.12 | 2.63 | 2.68 | 3.15 | 3.15 | 3.15 | 3.15 | 3.15 |
| EBIT | 66.5 | 1,583.0 | 2,039.5 | 2,032.9 | 2,322.7 | 2,095.6 | 2,316.9 | 2,561.5 | 2,832.0 | 3,131.0 |
| EBIT, % | 1.23 | 27.75 | 33.31 | 26.99 | 28.98 | 23.65 | 23.65 | 23.65 | 23.65 | 23.65 |
| Total Cash | 23,778.6 | 22,089.7 | 19,056.7 | 19,990.6 | 24,256.5 | 8,859.8 | 9,795.3 | 10,829.6 | 11,973.1 | 13,237.4 |
| Total Cash, percent | .0 | .0 | .0 | .0 | .0 | .0 | .0 | .0 | .0 | .0 |
| Account Receivables | 2,994.0 | 3,597.5 | 3,650.7 | 3,649.4 | 3,640.0 | 4,818.5 | 5,327.3 | 5,889.8 | 6,511.7 | 7,199.3 |
| Account Receivables, % | 55.37 | 63.06 | 59.63 | 48.45 | 45.42 | 54.39 | 54.39 | 54.39 | 54.39 | 54.39 |
| Inventories | .0 | .0 | .0 | .0 | .0 | .0 | .0 | .0 | .0 | .0 |
| Inventories, % | 0 | 0 | 0 | 0 | 0 | 0 | 0 | 0 | 0 | 0 |
| Accounts Payable | 531.0 | 870.7 | 926.5 | 1,127.1 | 1,082.2 | 1,217.0 | 1,345.6 | 1,487.6 | 1,644.7 | 1,818.4 |
| Accounts Payable, % | 9.82 | 15.26 | 15.13 | 14.96 | 13.5 | 13.74 | 13.74 | 13.74 | 13.74 | 13.74 |
| Capital Expenditure | -188.0 | -190.0 | -266.1 | -341.7 | -329.9 | -351.0 | -388.0 | -429.0 | -474.3 | -524.4 |
| Capital Expenditure, % | -3.48 | -3.33 | -4.35 | -4.54 | -4.12 | -3.96 | -3.96 | -3.96 | -3.96 | -3.96 |
| Tax Rate, % | 29.69 | 29.69 | 29.69 | 29.69 | 29.69 | 29.69 | 29.69 | 29.69 | 29.69 | 29.69 |
| EBITAT | 103.0 | 1,064.1 | 1,379.7 | 1,444.3 | 1,633.0 | 1,576.8 | 1,743.3 | 1,927.4 | 2,130.9 | 2,355.9 |
| Depreciation | ||||||||||
| Changes in Account Receivables | ||||||||||
| Changes in Inventories | ||||||||||
| Changes in Accounts Payable | ||||||||||
| Capital Expenditure | ||||||||||
| UFCF | -2,347.1 | 815.2 | 1,307.3 | 1,502.4 | 1,482.1 | 461.0 | 1,283.3 | 1,418.8 | 1,568.6 | 1,734.2 |
| WACC, % | 10.52 | 8.73 | 8.75 | 8.94 | 8.9 | 9.17 | 9.17 | 9.17 | 9.17 | 9.17 |
| PV UFCF | ||||||||||
| SUM PV UFCF | 4,812.5 | |||||||||
| Long Term Growth Rate, % | 2.00 | |||||||||
| Free cash flow (T + 1) | 1,769 | |||||||||
| Terminal Value | 24,679 | |||||||||
| Present Terminal Value | 15,917 | |||||||||
| Enterprise Value | 20,730 | |||||||||
| Net Debt | -2,974 | |||||||||
| Equity Value | 23,704 | |||||||||
| Diluted Shares Outstanding, MM | 80 | |||||||||
| Equity Value Per Share | 297.71 |
What You Will Receive
- Customizable Excel Template: A fully adjustable Excel-based DCF Calculator featuring pre-filled actual financials for Credicorp Ltd. (BAP).
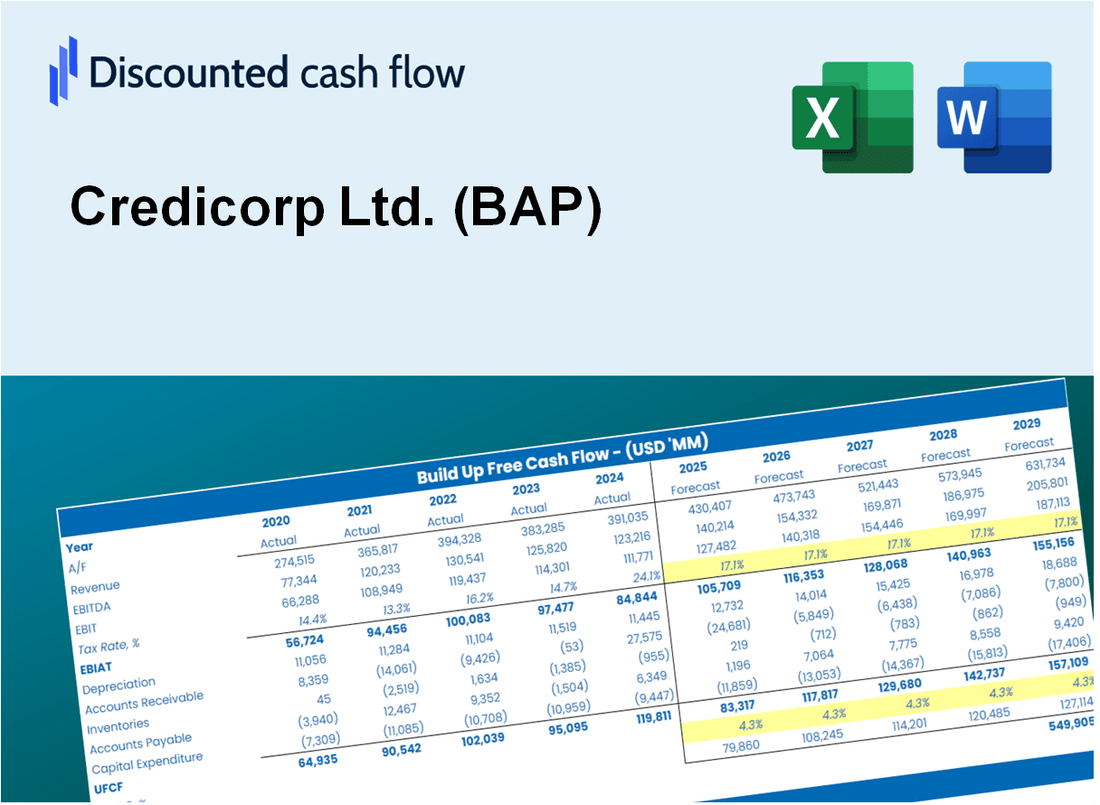
- Accurate Data: Historical performance data and future projections (highlighted in the yellow cells).
- Adjustable Forecasts: Modify key assumptions such as revenue growth, EBITDA %, and WACC.
- Instant Calculations: Quickly observe how your inputs affect the valuation of Credicorp Ltd. (BAP).
- Professional Resource: Designed for investors, CFOs, consultants, and financial analysts.
- Intuitive Layout: Organized for clarity and simplicity, complete with step-by-step guidance.
Key Features
- Customizable Financial Inputs: Adjust essential factors such as revenue growth rates, profit margins, and investment levels.
- Instant DCF Valuation: Automatically computes intrinsic value, net present value (NPV), and other key metrics.
- High-Precision Results: Leverages Credicorp Ltd.'s (BAP) actual financial data for accurate valuation insights.
- Simplified Scenario Testing: Easily evaluate various assumptions and analyze different outcomes.
- Efficiency Booster: Streamline the valuation process without the hassle of creating intricate models from the ground up.
How It Works
- 1. Access the Model: Download and open the Excel file featuring Credicorp Ltd.'s (BAP) financial data.
- 2. Modify Inputs: Adjust essential parameters such as growth projections, WACC, and capital expenditures.
- 3. Analyze Results Immediately: The DCF model automatically computes the intrinsic value and NPV.
- 4. Explore Scenarios: Evaluate various forecasts to understand different valuation results.
- 5. Present with Assurance: Share expert valuation analyses to bolster your decision-making process.
Why Choose This Calculator for Credicorp Ltd. (BAP)?
- Accurate Data: Utilize real Credicorp financials for trustworthy valuation outcomes.
- Customizable: Tailor essential parameters such as growth rates, WACC, and tax rates to align with your forecasts.
- Time-Saving: Pre-configured calculations save you the hassle of starting from the ground up.
- Professional-Grade Tool: Crafted for investors, analysts, and financial consultants.
- User-Friendly: An intuitive design and clear step-by-step guidance make it accessible for all users.
Who Should Use This Product?
- Individual Investors: Make informed decisions about buying or selling Credicorp Ltd. (BAP) stock.
- Financial Analysts: Streamline valuation processes with ready-to-use financial models for Credicorp Ltd. (BAP).
- Consultants: Deliver professional valuation insights on Credicorp Ltd. (BAP) to clients quickly and accurately.
- Business Owners: Understand how large financial institutions like Credicorp Ltd. (BAP) are valued to guide your own strategy.
- Finance Students: Learn valuation techniques using real-world data and scenarios related to Credicorp Ltd. (BAP).
What the Template Contains
- Historical Data: Includes Credicorp Ltd.'s (BAP) past financials and baseline forecasts.
- DCF and Levered DCF Models: Detailed templates to calculate Credicorp Ltd.'s (BAP) intrinsic value.
- WACC Sheet: Pre-built calculations for Weighted Average Cost of Capital.
- Editable Inputs: Modify key drivers like growth rates, EBITDA %, and CAPEX assumptions.
- Quarterly and Annual Statements: A complete breakdown of Credicorp Ltd.'s (BAP) financials.
- Interactive Dashboard: Visualize valuation results and projections dynamically.
Disclaimer
All information, articles, and product details provided on this website are for general informational and educational purposes only. We do not claim any ownership over, nor do we intend to infringe upon, any trademarks, copyrights, logos, brand names, or other intellectual property mentioned or depicted on this site. Such intellectual property remains the property of its respective owners, and any references here are made solely for identification or informational purposes, without implying any affiliation, endorsement, or partnership.
We make no representations or warranties, express or implied, regarding the accuracy, completeness, or suitability of any content or products presented. Nothing on this website should be construed as legal, tax, investment, financial, medical, or other professional advice. In addition, no part of this site—including articles or product references—constitutes a solicitation, recommendation, endorsement, advertisement, or offer to buy or sell any securities, franchises, or other financial instruments, particularly in jurisdictions where such activity would be unlawful.
All content is of a general nature and may not address the specific circumstances of any individual or entity. It is not a substitute for professional advice or services. Any actions you take based on the information provided here are strictly at your own risk. You accept full responsibility for any decisions or outcomes arising from your use of this website and agree to release us from any liability in connection with your use of, or reliance upon, the content or products found herein.