
|
Biocardia ، Inc. (BCDA) تقييم DCF |
Fully Editable: Tailor To Your Needs In Excel Or Sheets
Professional Design: Trusted, Industry-Standard Templates
Investor-Approved Valuation Models
MAC/PC Compatible, Fully Unlocked
No Expertise Is Needed; Easy To Follow
BioCardia, Inc. (BCDA) Bundle
قم بتقييم BioCardia، Inc. (BCDA) التوقعات المالية بدقة! تأتي حاسبة DCF (BCDA) هذه مع بيانات مالية مملوءة مسبقًا وتوفر لك المرونة لتعديل نمو الإيرادات و WACC والهوامش والافتراضات الحاسمة الأخرى لتتماشى مع توقعاتك.
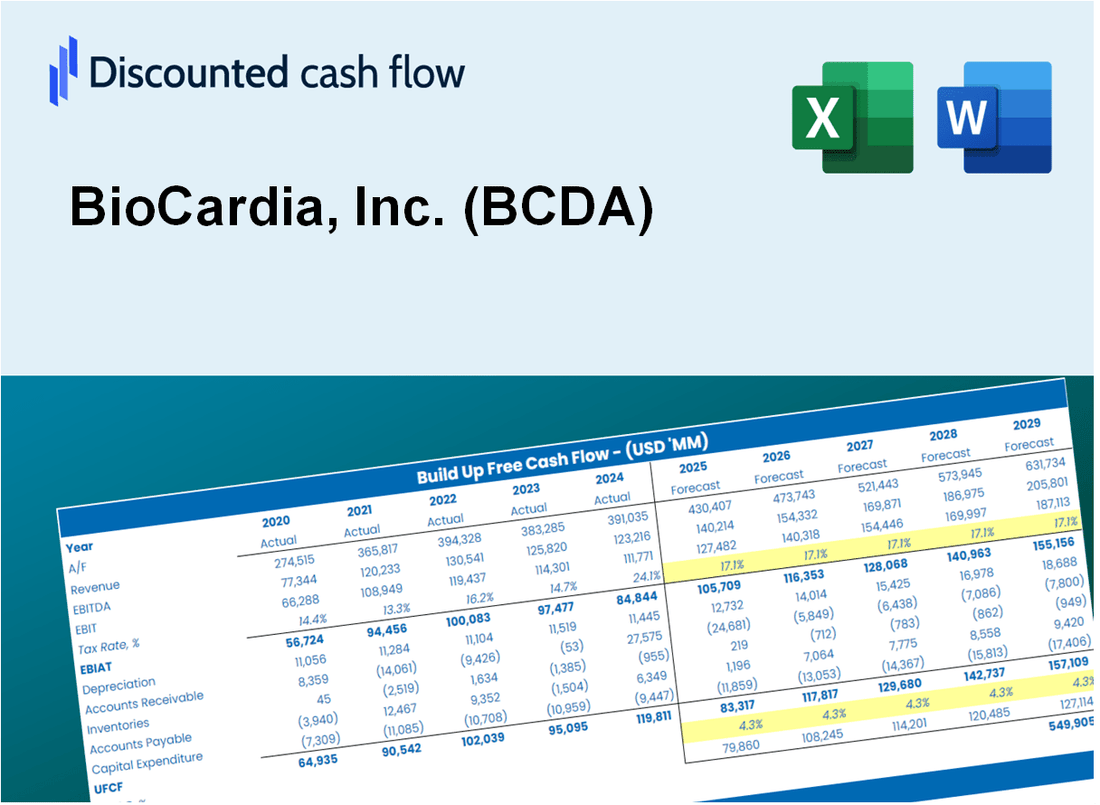
Discounted Cash Flow (DCF) - (USD MM)
| Year | AY1 2020 |
AY2 2021 |
AY3 2022 |
AY4 2023 |
AY5 2024 |
FY1 2025 |
FY2 2026 |
FY3 2027 |
FY4 2028 |
FY5 2029 |
|---|---|---|---|---|---|---|---|---|---|---|
| Revenue | .1 | 1.0 | 1.4 | .5 | .1 | .1 | .1 | .0 | .0 | .0 |
| Revenue Growth, % | 0 | 600 | 33.2 | -64.72 | -87.84 | -4.84 | -4.84 | -4.84 | -4.84 | -4.84 |
| EBITDA | -14.4 | -12.6 | -11.8 | -11.6 | -7.9 | -.1 | -.1 | .0 | .0 | .0 |
| EBITDA, % | -9955.17 | -1238.42 | -874.19 | -2423.48 | -13679.31 | -100 | -100 | -100 | -100 | -100 |
| Depreciation | .6 | .1 | .1 | .1 | .1 | .0 | .0 | .0 | .0 | .0 |
| Depreciation, % | 390.34 | 5.91 | 6.07 | 17.61 | 115.52 | 45.92 | 45.92 | 45.92 | 45.92 | 45.92 |
| EBIT | -15.0 | -12.6 | -11.9 | -11.6 | -8.0 | -.1 | -.1 | .0 | .0 | .0 |
| EBIT, % | -10345.52 | -1244.33 | -880.25 | -2441.09 | -13794.83 | -100 | -100 | -100 | -100 | -100 |
| Total Cash | 21.4 | 12.9 | 7.4 | 1.1 | 2.4 | .1 | .1 | .0 | .0 | .0 |
| Total Cash, percent | .0 | .0 | .0 | .0 | .0 | .0 | .0 | .0 | .0 | .0 |
| Account Receivables | .2 | .1 | .2 | .1 | .0 | .0 | .0 | .0 | .0 | .0 |
| Account Receivables, % | 160 | 14.48 | 14.87 | 13.21 | 0 | 28.51 | 28.51 | 28.51 | 28.51 | 28.51 |
| Inventories | .0 | .0 | .0 | .0 | .0 | .0 | .0 | .0 | .0 | .0 |
| Inventories, % | 0 | 0 | 0 | 0 | 0 | 0 | 0 | 0 | 0 | 0 |
| Accounts Payable | .7 | .5 | .7 | .9 | .4 | .0 | .0 | .0 | .0 | .0 |
| Accounts Payable, % | 514.48 | 49.95 | 50.52 | 186.58 | 663.79 | 80.09 | 80.09 | 80.09 | 80.09 | 80.09 |
| Capital Expenditure | .0 | -.1 | -.1 | .0 | .0 | .0 | .0 | .0 | .0 | .0 |
| Capital Expenditure, % | -22.07 | -11.43 | -5.18 | -2.52 | -10.34 | -10.31 | -10.31 | -10.31 | -10.31 | -10.31 |
| Tax Rate, % | 0 | 0 | 0 | 0 | 0 | 0 | 0 | 0 | 0 | 0 |
| EBITAT | -15.0 | -12.6 | -11.9 | -11.6 | -8.0 | -.1 | -.1 | .0 | .0 | .0 |
| Depreciation | ||||||||||
| Changes in Account Receivables | ||||||||||
| Changes in Inventories | ||||||||||
| Changes in Accounts Payable | ||||||||||
| Capital Expenditure | ||||||||||
| UFCF | -14.0 | -12.8 | -11.8 | -11.2 | -8.4 | -.4 | .0 | .0 | .0 | .0 |
| WACC, % | 6.19 | 6.19 | 6.19 | 6.19 | 6.19 | 6.19 | 6.19 | 6.19 | 6.19 | 6.19 |
| PV UFCF | ||||||||||
| SUM PV UFCF | -.5 | |||||||||
| Long Term Growth Rate, % | 2.00 | |||||||||
| Free cash flow (T + 1) | 0 | |||||||||
| Terminal Value | -1 | |||||||||
| Present Terminal Value | -1 | |||||||||
| Enterprise Value | -1 | |||||||||
| Net Debt | -1 | |||||||||
| Equity Value | 0 | |||||||||
| Diluted Shares Outstanding, MM | 3 | |||||||||
| Equity Value Per Share | 0.14 |
What You Will Get
- Editable Forecast Inputs: Easily modify assumptions (growth %, margins, WACC) to explore various scenarios.
- Real-World Data: BioCardia, Inc.'s (BCDA) financial data pre-loaded to kickstart your analysis.
- Automatic DCF Outputs: The template computes Net Present Value (NPV) and intrinsic value automatically.
- Customizable and Professional: A refined Excel model that adjusts to your valuation requirements.
- Built for Analysts and Investors: Perfect for evaluating projections, validating strategies, and enhancing efficiency.
Key Features
- Comprehensive BCDA Data: Pre-filled with BioCardia's historical performance metrics and future growth projections.
- Customizable Assumptions: Tailor inputs for revenue growth, profit margins, discount rates, tax considerations, and capital investments.
- Interactive Valuation Model: Automatic recalculations of Net Present Value (NPV) and intrinsic value based on your specified parameters.
- Scenario Analysis: Develop various forecasting scenarios to evaluate different valuation possibilities.
- Intuitive User Interface: Designed for ease of use, catering to both experienced professionals and newcomers.
How It Works
- Step 1: Download the Excel file.
- Step 2: Review pre-entered BioCardia data (historical and projected).
- Step 3: Adjust key assumptions (yellow cells) based on your analysis.
- Step 4: View automatic recalculations for BioCardia’s intrinsic value.
- Step 5: Use the outputs for investment decisions or reporting.
Why Choose This Calculator for BioCardia, Inc. (BCDA)?
- All-in-One Solution: Features DCF, WACC, and financial ratio analyses tailored for BioCardia, Inc. (BCDA).
- Flexible Inputs: Modify the highlighted cells to explore different financial scenarios.
- In-Depth Analysis: Automatically computes BioCardia, Inc.'s (BCDA) intrinsic value and Net Present Value.
- Preloaded Information: Historical and projected data provide reliable starting points for analysis.
- Expert-Level Tool: Perfect for financial analysts, investors, and consultants focusing on BioCardia, Inc. (BCDA).
Who Should Use This Product?
- Individual Investors: Make informed decisions regarding the purchase or sale of BioCardia stock (BCDA).
- Financial Analysts: Enhance valuation processes with ready-to-implement financial models specific to BioCardia.
- Consultants: Provide clients with professional valuation insights on BioCardia quickly and accurately.
- Business Owners: Gain insights into how biotech companies like BioCardia are valued to inform your own business strategies.
- Finance Students: Explore valuation techniques using real-world data and case studies related to BioCardia.
What the Template Contains
- Operating and Balance Sheet Data: Pre-filled BioCardia historical data and forecasts, including revenue, EBITDA, EBIT, and capital expenditures.
- WACC Calculation: A dedicated sheet for Weighted Average Cost of Capital (WACC), including parameters like Beta, risk-free rate, and share price.
- DCF Valuation (Unlevered and Levered): Editable Discounted Cash Flow models showing intrinsic value with detailed calculations.
- Financial Statements: Pre-loaded financial statements (annual and quarterly) to support analysis.
- Key Ratios: Includes profitability, leverage, and efficiency ratios for BioCardia, Inc. (BCDA).
- Dashboard and Charts: Visual summary of valuation outputs and assumptions to analyze results easily.
Disclaimer
All information, articles, and product details provided on this website are for general informational and educational purposes only. We do not claim any ownership over, nor do we intend to infringe upon, any trademarks, copyrights, logos, brand names, or other intellectual property mentioned or depicted on this site. Such intellectual property remains the property of its respective owners, and any references here are made solely for identification or informational purposes, without implying any affiliation, endorsement, or partnership.
We make no representations or warranties, express or implied, regarding the accuracy, completeness, or suitability of any content or products presented. Nothing on this website should be construed as legal, tax, investment, financial, medical, or other professional advice. In addition, no part of this site—including articles or product references—constitutes a solicitation, recommendation, endorsement, advertisement, or offer to buy or sell any securities, franchises, or other financial instruments, particularly in jurisdictions where such activity would be unlawful.
All content is of a general nature and may not address the specific circumstances of any individual or entity. It is not a substitute for professional advice or services. Any actions you take based on the information provided here are strictly at your own risk. You accept full responsibility for any decisions or outcomes arising from your use of this website and agree to release us from any liability in connection with your use of, or reliance upon, the content or products found herein.