
|
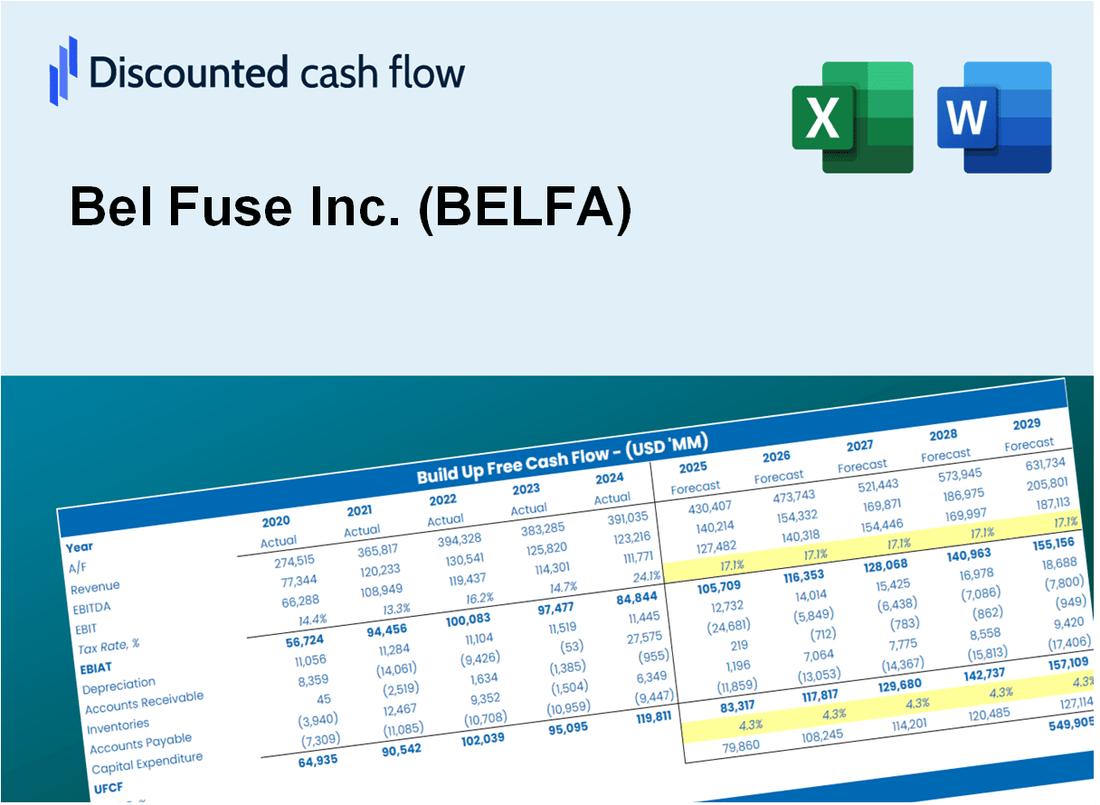
Bel Fuse Inc. (Belfa) DCF تقييم |
Fully Editable: Tailor To Your Needs In Excel Or Sheets
Professional Design: Trusted, Industry-Standard Templates
Investor-Approved Valuation Models
MAC/PC Compatible, Fully Unlocked
No Expertise Is Needed; Easy To Follow
Bel Fuse Inc. (BELFA) Bundle
سواء كنت مستثمرًا أو محللًا ، فإن حاسبة DCF (Belfa) هذه هي موردك للتقييم الدقيق. محملة بالبيانات الحقيقية من Bel Fuse Inc. ، يمكنك ضبط التوقعات ومراقبة التأثيرات على الفور.
What You Will Get
- Editable Forecast Inputs: Easily modify assumptions (growth %, margins, WACC) to generate various scenarios.
- Real-World Data: Bel Fuse Inc.’s financial data pre-filled to facilitate your analysis.
- Automatic DCF Outputs: The template computes Net Present Value (NPV) and intrinsic value automatically.
- Customizable and Professional: A refined Excel model tailored to meet your valuation requirements.
- Built for Analysts and Investors: Perfect for evaluating projections, confirming strategies, and optimizing time.
Key Features
- Comprehensive Financial Data: Access reliable historical performance and future forecasts for Bel Fuse Inc. (BELFA).
- Adjustable Forecast Parameters: Modify highlighted cells for key metrics such as WACC, growth rates, and profit margins.
- Real-Time Calculations: Instant updates for DCF, Net Present Value (NPV), and cash flow assessments.
- User-Friendly Dashboard: Intuitive charts and summaries to easily interpret your valuation findings.
- Suitable for All Levels: Designed for investors, financial officers, and consultants with a straightforward layout.
How It Works
- Step 1: Download the Excel file.
- Step 2: Review pre-entered Bel Fuse Inc. (BELFA) data (historical and projected).
- Step 3: Adjust key assumptions (yellow cells) based on your analysis.
- Step 4: View automatic recalculations for Bel Fuse Inc.'s intrinsic value.
- Step 5: Use the outputs for investment decisions or reporting.
Why Choose This Calculator for Bel Fuse Inc. (BELFA)?
- All-in-One Solution: Combines DCF, WACC, and financial ratio analyses tailored for Bel Fuse Inc.
- Flexible Inputs: Modify yellow-highlighted fields to explore different financial scenarios.
- In-Depth Analysis: Automatically computes Bel Fuse’s intrinsic value and Net Present Value.
- Preloaded Information: Includes historical and projected data for precise calculations.
- High-Quality Standards: Perfect for financial analysts, investors, and business consultants focusing on Bel Fuse Inc.
Who Should Use This Product?
- Investors: Accurately estimate Bel Fuse Inc.’s (BELFA) fair value before making investment decisions.
- CFOs: Utilize a professional-grade DCF model for financial reporting and analysis specific to Bel Fuse Inc. (BELFA).
- Consultants: Efficiently customize the template for valuation reports tailored to Bel Fuse Inc. (BELFA) clients.
- Entrepreneurs: Discover financial modeling insights employed by leading companies like Bel Fuse Inc. (BELFA).
- Educators: Implement it as a teaching resource to illustrate valuation methodologies relevant to Bel Fuse Inc. (BELFA).
What the Template Contains
- Pre-Filled DCF Model: Bel Fuse Inc.'s (BELFA) financial data preloaded for immediate use.
- WACC Calculator: Detailed calculations for Weighted Average Cost of Capital.
- Financial Ratios: Evaluate Bel Fuse Inc.'s (BELFA) profitability, leverage, and efficiency.
- Editable Inputs: Change assumptions such as growth, margins, and CAPEX to fit your scenarios.
- Financial Statements: Annual and quarterly reports to support detailed analysis.
- Interactive Dashboard: Easily visualize key valuation metrics and results.
Disclaimer
All information, articles, and product details provided on this website are for general informational and educational purposes only. We do not claim any ownership over, nor do we intend to infringe upon, any trademarks, copyrights, logos, brand names, or other intellectual property mentioned or depicted on this site. Such intellectual property remains the property of its respective owners, and any references here are made solely for identification or informational purposes, without implying any affiliation, endorsement, or partnership.
We make no representations or warranties, express or implied, regarding the accuracy, completeness, or suitability of any content or products presented. Nothing on this website should be construed as legal, tax, investment, financial, medical, or other professional advice. In addition, no part of this site—including articles or product references—constitutes a solicitation, recommendation, endorsement, advertisement, or offer to buy or sell any securities, franchises, or other financial instruments, particularly in jurisdictions where such activity would be unlawful.
All content is of a general nature and may not address the specific circumstances of any individual or entity. It is not a substitute for professional advice or services. Any actions you take based on the information provided here are strictly at your own risk. You accept full responsibility for any decisions or outcomes arising from your use of this website and agree to release us from any liability in connection with your use of, or reliance upon, the content or products found herein.