
|
Banco Santander (Brasil) S.A (BSBR) تقييم DCF |
Fully Editable: Tailor To Your Needs In Excel Or Sheets
Professional Design: Trusted, Industry-Standard Templates
Investor-Approved Valuation Models
MAC/PC Compatible, Fully Unlocked
No Expertise Is Needed; Easy To Follow
Banco Santander (Brasil) S.A. (BSBR) Bundle
استكشف الآفاق المالية لـ Banco Santander (Brasil) S.A (BSBR) باستخدام حاسبة DCF سهلة الاستخدام! أدخل توقعاتك للنمو والهوامش والنفقات لتحديد القيمة الجوهرية لـ Banco Santander (Brasil) S.A (BSBR) وصقل إستراتيجيتك الاستثمارية.
Discounted Cash Flow (DCF) - (USD MM)
| Year | AY1 2020 |
AY2 2021 |
AY3 2022 |
AY4 2023 |
AY5 2024 |
FY1 2025 |
FY2 2026 |
FY3 2027 |
FY4 2028 |
FY5 2029 |
|---|---|---|---|---|---|---|---|---|---|---|
| Revenue | 6,119.8 | 9,196.7 | 8,169.9 | 7,543.8 | 24,354.1 | 32,357.3 | 42,990.6 | 57,118.1 | 75,888.3 | 100,826.7 |
| Revenue Growth, % | 0 | 50.28 | -11.16 | -7.66 | 222.84 | 32.86 | 32.86 | 32.86 | 32.86 | 32.86 |
| EBITDA | .0 | .0 | .0 | .0 | 4,137.8 | 1,099.5 | 1,460.8 | 1,940.9 | 2,578.7 | 3,426.1 |
| EBITDA, % | 0 | 0 | 0 | 0 | 16.99 | 3.4 | 3.4 | 3.4 | 3.4 | 3.4 |
| Depreciation | 486.8 | 459.4 | 488.0 | 517.4 | 515.5 | 1,805.5 | 2,398.8 | 3,187.1 | 4,234.4 | 5,625.9 |
| Depreciation, % | 7.95 | 5 | 5.97 | 6.86 | 2.12 | 5.58 | 5.58 | 5.58 | 5.58 | 5.58 |
| EBIT | -486.8 | -459.4 | -488.0 | -517.4 | 3,622.3 | -706.0 | -938.0 | -1,246.2 | -1,655.7 | -2,199.8 |
| EBIT, % | -7.95 | -5 | -5.97 | -6.86 | 14.87 | -2.18 | -2.18 | -2.18 | -2.18 | -2.18 |
| Total Cash | 24,517.6 | 22,254.3 | 28,403.4 | 47,763.7 | 56,054.0 | 32,357.3 | 42,990.6 | 57,118.1 | 75,888.3 | 100,826.7 |
| Total Cash, percent | .0 | .0 | .0 | .0 | .0 | .0 | .0 | .0 | .0 | .0 |
| Account Receivables | 1,333.0 | 1,714.0 | 2,791.5 | 2,600.8 | 3,204.3 | 7,909.4 | 10,508.6 | 13,962.0 | 18,550.2 | 24,646.1 |
| Account Receivables, % | 21.78 | 18.64 | 34.17 | 34.48 | 13.16 | 24.44 | 24.44 | 24.44 | 24.44 | 24.44 |
| Inventories | .0 | .0 | .0 | 2,841.0 | .0 | 2,437.2 | 3,238.1 | 4,302.2 | 5,716.0 | 7,594.3 |
| Inventories, % | 0 | 0 | 0 | 37.66 | 0 | 7.53 | 7.53 | 7.53 | 7.53 | 7.53 |
| Accounts Payable | .0 | .0 | .0 | .0 | .0 | .0 | .0 | .0 | .0 | .0 |
| Accounts Payable, % | 0 | 0 | 0 | 0 | 0 | 0 | 0 | 0 | 0 | 0 |
| Capital Expenditure | -378.6 | -446.4 | -540.5 | -632.9 | -492.7 | -1,816.5 | -2,413.4 | -3,206.5 | -4,260.2 | -5,660.2 |
| Capital Expenditure, % | -6.19 | -4.85 | -6.62 | -8.39 | -2.02 | -5.61 | -5.61 | -5.61 | -5.61 | -5.61 |
| Tax Rate, % | 30.35 | 30.35 | 30.35 | 30.35 | 30.35 | 30.35 | 30.35 | 30.35 | 30.35 | 30.35 |
| EBITAT | -676.0 | -288.2 | -356.2 | -410.1 | 2,522.8 | -543.1 | -721.5 | -958.7 | -1,273.7 | -1,692.2 |
| Depreciation | ||||||||||
| Changes in Account Receivables | ||||||||||
| Changes in Inventories | ||||||||||
| Changes in Accounts Payable | ||||||||||
| Capital Expenditure | ||||||||||
| UFCF | -1,900.7 | -656.2 | -1,486.2 | -3,176.0 | 4,783.3 | -7,696.4 | -4,136.2 | -5,495.5 | -7,301.4 | -9,700.8 |
| WACC, % | 24.1 | 16.34 | 18.48 | 19.78 | 17.78 | 19.3 | 19.3 | 19.3 | 19.3 | 19.3 |
| PV UFCF | ||||||||||
| SUM PV UFCF | -20,214.0 | |||||||||
| Long Term Growth Rate, % | 2.00 | |||||||||
| Free cash flow (T + 1) | -9,895 | |||||||||
| Terminal Value | -57,204 | |||||||||
| Present Terminal Value | -23,674 | |||||||||
| Enterprise Value | -43,888 | |||||||||
| Net Debt | -13,121 | |||||||||
| Equity Value | -30,767 | |||||||||
| Diluted Shares Outstanding, MM | 7,460 | |||||||||
| Equity Value Per Share | -4.12 |
What You Will Get
- Editable Excel Template: A fully customizable Excel-based DCF Calculator featuring pre-filled real BSBR financials.
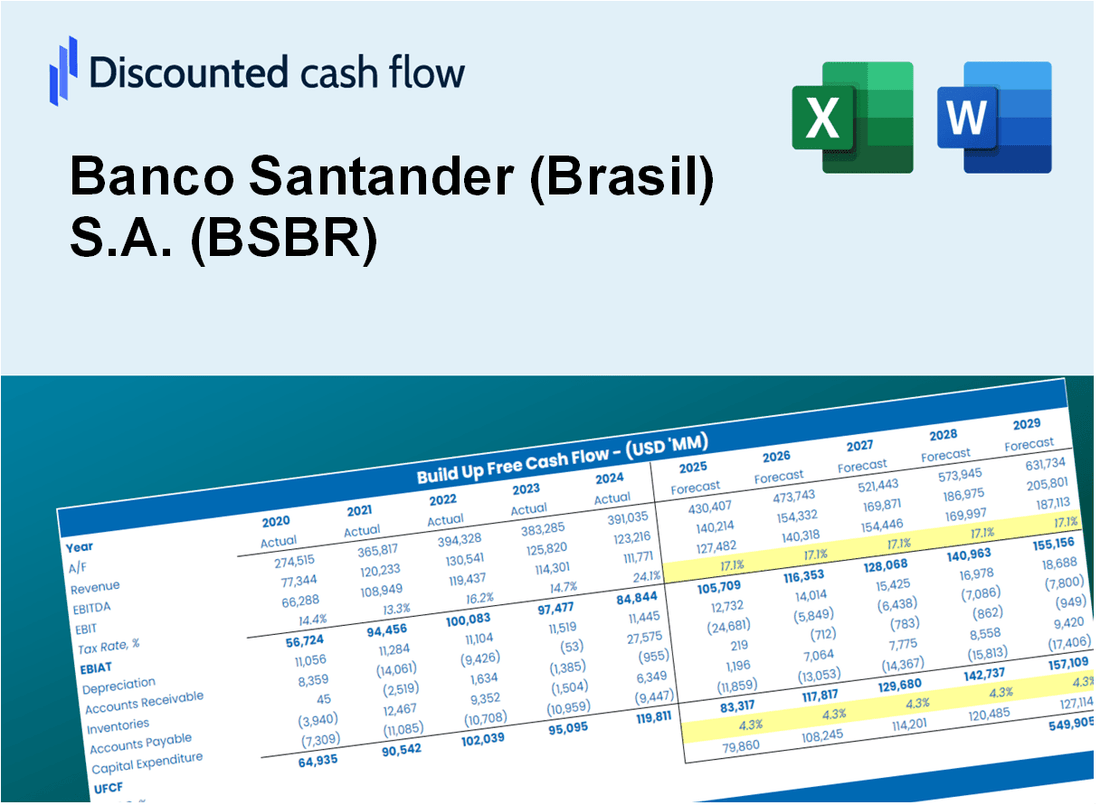
- Real-World Data: Historical data and forward-looking estimates (as indicated in the yellow cells).
- Forecast Flexibility: Adjust forecast assumptions such as revenue growth, EBITDA %, and WACC.
- Automatic Calculations: Instantly observe the effects of your inputs on Banco Santander's valuation.
- Professional Tool: Designed for investors, CFOs, consultants, and financial analysts.
- User-Friendly Design: Organized for clarity and ease of use, complete with step-by-step instructions.
Key Features
- Accurate Financial Data: Gain access to reliable pre-loaded historical performance and future forecasts for Banco Santander (Brasil) S.A. (BSBR).
- Adjustable Forecast Parameters: Modify highlighted cells to tailor WACC, growth rates, and profit margins to your analysis.
- Automated Calculations: Real-time updates for DCF, Net Present Value (NPV), and cash flow assessments.
- Interactive Dashboard: User-friendly charts and summaries to help visualize your valuation insights.
- Designed for All Skill Levels: An intuitive layout suitable for investors, CFOs, and financial consultants alike.
How It Works
- Download the Template: Gain immediate access to the Excel-based BSBR DCF Calculator.
- Input Your Assumptions: Modify the yellow-highlighted cells for growth rates, WACC, margins, and other variables.
- Instant Calculations: The model automatically computes Banco Santander's intrinsic value.
- Test Scenarios: Explore various assumptions to assess potential changes in valuation.
- Analyze and Decide: Utilize the results to inform your investment or financial analysis decisions.
Why Choose This Calculator for Banco Santander (Brasil) S.A. (BSBR)?
- Accurate Data: Utilize real Banco Santander financials for dependable valuation outcomes.
- Customizable: Modify essential parameters such as growth rates, WACC, and tax rates to fit your forecasts.
- Time-Saving: Built-in calculations save you the hassle of starting from the ground up.
- Professional-Grade Tool: Tailored for investors, analysts, and financial consultants.
- User-Friendly: Easy-to-navigate design and clear instructions make it accessible for everyone.
Who Should Use This Product?
- Finance Students: Discover banking principles and apply them using real market data from Banco Santander (Brasil) S.A. (BSBR).
- Academics: Integrate advanced financial models into your research or teaching materials.
- Investors: Evaluate your investment strategies and analyze the performance of Banco Santander (Brasil) S.A. (BSBR).
- Analysts: Enhance your analysis process with a customizable financial model tailored for Banco Santander (Brasil) S.A. (BSBR).
- Small Business Owners: Understand how large financial institutions like Banco Santander (Brasil) S.A. (BSBR) manage their operations and assess risk.
What the Template Contains
- Pre-Filled DCF Model: Banco Santander (Brasil) S.A. (BSBR) financial data preloaded for immediate use.
- WACC Calculator: Detailed calculations for Weighted Average Cost of Capital.
- Financial Ratios: Evaluate Banco Santander (Brasil) S.A. (BSBR)'s profitability, leverage, and efficiency.
- Editable Inputs: Change assumptions such as growth, margins, and CAPEX to fit your scenarios.
- Financial Statements: Annual and quarterly reports to support detailed analysis.
- Interactive Dashboard: Easily visualize key valuation metrics and results.
Disclaimer
All information, articles, and product details provided on this website are for general informational and educational purposes only. We do not claim any ownership over, nor do we intend to infringe upon, any trademarks, copyrights, logos, brand names, or other intellectual property mentioned or depicted on this site. Such intellectual property remains the property of its respective owners, and any references here are made solely for identification or informational purposes, without implying any affiliation, endorsement, or partnership.
We make no representations or warranties, express or implied, regarding the accuracy, completeness, or suitability of any content or products presented. Nothing on this website should be construed as legal, tax, investment, financial, medical, or other professional advice. In addition, no part of this site—including articles or product references—constitutes a solicitation, recommendation, endorsement, advertisement, or offer to buy or sell any securities, franchises, or other financial instruments, particularly in jurisdictions where such activity would be unlawful.
All content is of a general nature and may not address the specific circumstances of any individual or entity. It is not a substitute for professional advice or services. Any actions you take based on the information provided here are strictly at your own risk. You accept full responsibility for any decisions or outcomes arising from your use of this website and agree to release us from any liability in connection with your use of, or reliance upon, the content or products found herein.