
|
Brightspring Health Services ، Inc. (BTSG) DCF تقييم |
Fully Editable: Tailor To Your Needs In Excel Or Sheets
Professional Design: Trusted, Industry-Standard Templates
Investor-Approved Valuation Models
MAC/PC Compatible, Fully Unlocked
No Expertise Is Needed; Easy To Follow
BrightSpring Health Services, Inc. Common Stock (BTSG) Bundle
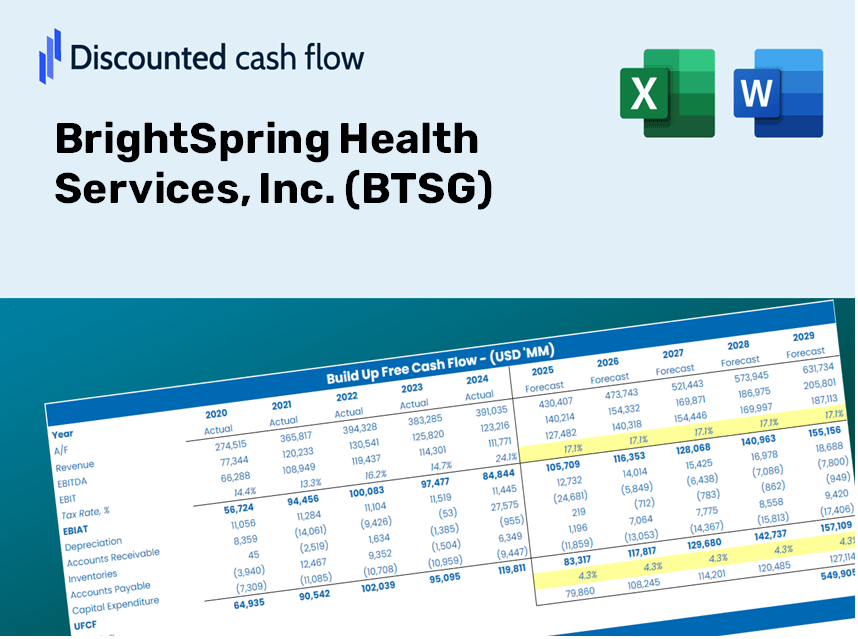
سواء كنت مستثمرًا أو محللًا ، فإن حاسبة DCF (BTSG) هذه هي موردك للتقييم الدقيق. مجهزة ببيانات حقيقية من BrightSpring Health Services ، Inc. ، يمكنك ضبط التوقعات وشاهد الآثار في الوقت الفعلي.
Discounted Cash Flow (DCF) - (USD MM)
| Year | AY1 2020 |
AY2 2021 |
AY3 2022 |
AY4 2023 |
AY5 2024 |
FY1 2025 |
FY2 2026 |
FY3 2027 |
FY4 2028 |
FY5 2029 |
|---|---|---|---|---|---|---|---|---|---|---|
| Revenue | 5,580.4 | 6,698.1 | 7,720.6 | 8,826.2 | 11,266.5 | 13,442.7 | 16,039.3 | 19,137.4 | 22,833.9 | 27,244.5 |
| Revenue Growth, % | 0 | 20.03 | 15.27 | 14.32 | 27.65 | 19.32 | 19.32 | 19.32 | 19.32 | 19.32 |
| EBITDA | 346.7 | 433.3 | 391.8 | 349.5 | 398.1 | 678.9 | 810.0 | 966.5 | 1,153.2 | 1,375.9 |
| EBITDA, % | 6.21 | 6.47 | 5.07 | 3.96 | 3.53 | 5.05 | 5.05 | 5.05 | 5.05 | 5.05 |
| Depreciation | 181.5 | 199.2 | 204.0 | 202.3 | 204.5 | 348.8 | 416.2 | 496.6 | 592.5 | 707.0 |
| Depreciation, % | 3.25 | 2.97 | 2.64 | 2.29 | 1.81 | 2.6 | 2.6 | 2.6 | 2.6 | 2.6 |
| EBIT | 165.2 | 234.2 | 187.8 | 147.2 | 193.6 | 330.0 | 393.8 | 469.8 | 560.6 | 668.9 |
| EBIT, % | 2.96 | 3.5 | 2.43 | 1.67 | 1.72 | 2.46 | 2.46 | 2.46 | 2.46 | 2.46 |
| Total Cash | 262.0 | 46.7 | 13.6 | 13.1 | 61.3 | 168.3 | 200.8 | 239.6 | 285.9 | 341.2 |
| Total Cash, percent | .0 | .0 | .0 | .0 | .0 | .0 | .0 | .0 | .0 | .0 |
| Account Receivables | 700.8 | 805.0 | 868.4 | 1,010.8 | 1,149.1 | 1,545.3 | 1,843.7 | 2,199.9 | 2,624.8 | 3,131.8 |
| Account Receivables, % | 12.56 | 12.02 | 11.25 | 11.45 | 10.2 | 11.5 | 11.5 | 11.5 | 11.5 | 11.5 |
| Inventories | 300.1 | 299.2 | 430.5 | 402.8 | 640.6 | 690.1 | 823.4 | 982.5 | 1,172.3 | 1,398.7 |
| Inventories, % | 5.38 | 4.47 | 5.58 | 4.56 | 5.69 | 5.13 | 5.13 | 5.13 | 5.13 | 5.13 |
| Accounts Payable | 355.8 | 408.1 | 526.9 | 641.6 | 941.3 | 938.8 | 1,120.1 | 1,336.4 | 1,594.6 | 1,902.6 |
| Accounts Payable, % | 6.38 | 6.09 | 6.82 | 7.27 | 8.35 | 6.98 | 6.98 | 6.98 | 6.98 | 6.98 |
| Capital Expenditure | -51.9 | -59.3 | -70.1 | -73.5 | -80.9 | -114.9 | -137.1 | -163.6 | -195.2 | -232.9 |
| Capital Expenditure, % | -0.93019 | -0.88488 | -0.90813 | -0.83306 | -0.71818 | -0.85489 | -0.85489 | -0.85489 | -0.85489 | -0.85489 |
| Tax Rate, % | 48.01 | 48.01 | 48.01 | 48.01 | 48.01 | 48.01 | 48.01 | 48.01 | 48.01 | 48.01 |
| EBITAT | 131.0 | 169.4 | 221.3 | 128.3 | 100.7 | 257.9 | 307.8 | 367.2 | 438.1 | 522.8 |
| Depreciation | ||||||||||
| Changes in Account Receivables | ||||||||||
| Changes in Inventories | ||||||||||
| Changes in Accounts Payable | ||||||||||
| Capital Expenditure | ||||||||||
| UFCF | -384.5 | 258.3 | 279.3 | 257.1 | 147.8 | 43.6 | 336.4 | 401.4 | 478.9 | 571.4 |
| WACC, % | 12.05 | 11.86 | 12.62 | 12.27 | 11.31 | 12.02 | 12.02 | 12.02 | 12.02 | 12.02 |
| PV UFCF | ||||||||||
| SUM PV UFCF | 1,220.6 | |||||||||
| Long Term Growth Rate, % | 2.00 | |||||||||
| Free cash flow (T + 1) | 583 | |||||||||
| Terminal Value | 5,816 | |||||||||
| Present Terminal Value | 3,297 | |||||||||
| Enterprise Value | 4,517 | |||||||||
| Net Debt | 2,844 | |||||||||
| Equity Value | 1,674 | |||||||||
| Diluted Shares Outstanding, MM | 193 | |||||||||
| Equity Value Per Share | 8.67 |
ما ستحصل عليه
- بيانات الربيع الساطع الأصيلة: المعلومات المالية المحملة مسبقًا - من الإيرادات إلى الأرباح قبل الفوائد والضرائب - بناءً على المقاييس الفعلية والمتوقعة.
- التخصيص الشامل: تعديل جميع المعلمات الرئيسية (الخلايا الصفراء) مثل WACC والنمو٪ ومعدلات الضرائب.
- تسويات التقييم الفوري: إعادة الحساب التلقائية لتقييم آثار التغييرات على القيمة العادلة لـ BrightSpring.
- قالب إكسل مرن: مصممة للتعديلات السريعة وتحليل السيناريوهات والنمذجة التفصيلية للتنبؤ.
- كفاءة ودقة: تجنب بناء النماذج من الألف إلى الياء مع ضمان الدقة والقدرة على التكيف.
الفوائد الأساسية
- مدخلات التنبؤ القابلة للتخصيص: اضبط المقاييس الأساسية مثل نمو المريض وتكاليف توسيع الخدمة والنفقات التشغيلية.
- تقييم DCF الفوري: تحسب بسرعة القيمة الجوهرية ، صافي القيمة الحالية (NPV) ، والمقاييس المالية الإضافية.
- دقة عالية الدقة: يعزز البيانات المالية الفعلية لـ BrightSpring لنتائج التقييم الموثوقة.
- تحليل سيناريو مبسط: قم بتقييم الافتراضات المختلفة بسهولة وتقييم النتائج جنبًا إلى جنب.
- داعم الكفاءة: يزيل ضرورة بناء نماذج تقييم معقدة من الألف إلى الياء.
كيف تعمل
- الخطوة 1: قم بتنزيل جدول بيانات Excel.
- الخطوة 2: فحص البيانات المملوءة مسبقًا لـ Brightspring Health Services ، Inc. (BTSG) (التاريخية والمتوقعة).
- الخطوة 3: قم بتعديل الافتراضات الرئيسية (المميزة باللون الأصفر) وفقًا لرؤيتك.
- الخطوة 4: راقب التحديثات التلقائية لقيمة Brightspring الجوهرية.
- الخطوة 5: الاستفادة من نتائج استراتيجيات الاستثمار الخاصة بك أو احتياجات الإبلاغ.
لماذا تختار هذه الآلة الحاسبة؟
- واجهة سهلة الاستخدام: صُمم لتلبية احتياجات كل من المبتدئين والمستخدمين ذوي الخبرة.
- مدخلات قابلة للتخصيص: بسهولة ضبط المعلمات لتناسب تحليلك المحدد.
- تحديثات الوقت الحقيقي: راقب التغييرات الفورية على تقييم Brightspring Health Services ، Inc. (BTSG) أثناء تعديل المدخلات.
- البيانات المحملة مسبقًا: يأتي مزود بالمعلومات المالية الفعلية لـ Brightspring للتقييمات السريعة.
- يفضله الخبراء: يعمل من قبل المستثمرين والمحللين لقيادة اتخاذ القرارات المستنيرة.
من يمكنه الاستفادة من هذه الخدمة؟
- المستثمرون: تقييم تقييم Brightspring Health Services ، Inc. (BTSG) قبل اتخاذ قرارات الاستثمار.
- كبار المسؤولين والمحللين الماليين: تحسين سير عمل التقييم وتقييم التوقعات المالية.
- مؤسسو الشركات الناشئة: فهم منهجيات التقييم المستخدمة للشركات القائمة مثل Brightspring Health Services ، Inc. (BTSG).
- الاستشاريون: قم بإنشاء تقارير تقييم مفصلة لعملائها بناءً على Brightspring Health Services ، Inc. (BTSG).
- الطلاب والمعلمين: الاستفادة من بيانات السوق الحالية لتعلم وتدريس استراتيجيات التقييم بفعالية.
محتويات القالب
- البيانات المليئة مسبقا: يحتوي على الأداء المالي التاريخي لشركة Brightspring Health ، Inc..
- نموذج التدفق النقدي المخفض: نموذج تقييم DCF قابل للتحرير مع الحسابات الآلية.
- متوسط تكلفة رأس المال المرجح (WACC): ورقة عمل منفصلة لحساب WACC استنادًا إلى المدخلات المعرفة من قبل المستخدم.
- النسب المالية الرئيسية: تقييم الربحية والكفاءة والرافعة المالية لخدمات Brightspring Health Services ، Inc. (BTSG).
- مدخلات قابلة للتخصيص: بسهولة تعديل معدلات نمو الإيرادات والهوامش ومعدلات الضرائب.
- لوحة معلومات سهلة الاستخدام: التصورات والجداول التي تبرز نتائج التقييم الأساسية.
Disclaimer
All information, articles, and product details provided on this website are for general informational and educational purposes only. We do not claim any ownership over, nor do we intend to infringe upon, any trademarks, copyrights, logos, brand names, or other intellectual property mentioned or depicted on this site. Such intellectual property remains the property of its respective owners, and any references here are made solely for identification or informational purposes, without implying any affiliation, endorsement, or partnership.
We make no representations or warranties, express or implied, regarding the accuracy, completeness, or suitability of any content or products presented. Nothing on this website should be construed as legal, tax, investment, financial, medical, or other professional advice. In addition, no part of this site—including articles or product references—constitutes a solicitation, recommendation, endorsement, advertisement, or offer to buy or sell any securities, franchises, or other financial instruments, particularly in jurisdictions where such activity would be unlawful.
All content is of a general nature and may not address the specific circumstances of any individual or entity. It is not a substitute for professional advice or services. Any actions you take based on the information provided here are strictly at your own risk. You accept full responsibility for any decisions or outcomes arising from your use of this website and agree to release us from any liability in connection with your use of, or reliance upon, the content or products found herein.