
|
BrightSpring Health Services, Inc. (BTSG) Évaluation DCF |
Entièrement Modifiable: Adapté À Vos Besoins Dans Excel Ou Sheets
Conception Professionnelle: Modèles Fiables Et Conformes Aux Normes Du Secteur
Pré-Construits Pour Une Utilisation Rapide Et Efficace
Compatible MAC/PC, entièrement débloqué
Aucune Expertise N'Est Requise; Facile À Suivre
BrightSpring Health Services, Inc. Common Stock (BTSG) Bundle
Que vous soyez un investisseur ou un analyste, cette calculatrice DCF (BTSG) est votre ressource incontournable pour une évaluation précise. Équipé de données réelles de BrightSpring Health Services, Inc., vous pouvez ajuster les prévisions et assister aux effets en temps réel.
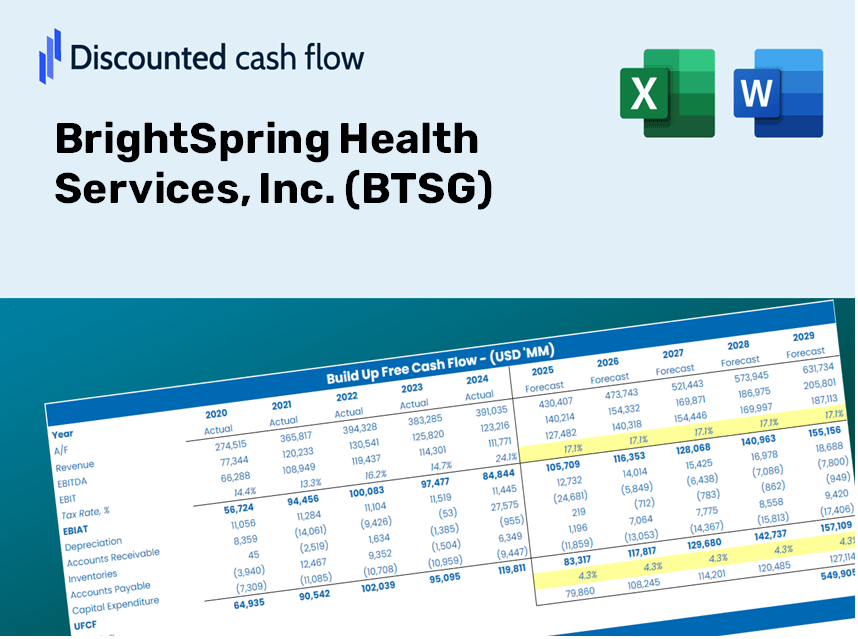
Discounted Cash Flow (DCF) - (USD MM)
| Year | AY1 2020 |
AY2 2021 |
AY3 2022 |
AY4 2023 |
AY5 2024 |
FY1 2025 |
FY2 2026 |
FY3 2027 |
FY4 2028 |
FY5 2029 |
|---|---|---|---|---|---|---|---|---|---|---|
| Revenue | 5,580.4 | 6,698.1 | 7,720.6 | 8,826.2 | 11,266.5 | 13,442.7 | 16,039.3 | 19,137.4 | 22,833.9 | 27,244.5 |
| Revenue Growth, % | 0 | 20.03 | 15.27 | 14.32 | 27.65 | 19.32 | 19.32 | 19.32 | 19.32 | 19.32 |
| EBITDA | 346.7 | 433.3 | 391.8 | 349.5 | 398.1 | 678.9 | 810.0 | 966.5 | 1,153.2 | 1,375.9 |
| EBITDA, % | 6.21 | 6.47 | 5.07 | 3.96 | 3.53 | 5.05 | 5.05 | 5.05 | 5.05 | 5.05 |
| Depreciation | 181.5 | 199.2 | 204.0 | 202.3 | 204.5 | 348.8 | 416.2 | 496.6 | 592.5 | 707.0 |
| Depreciation, % | 3.25 | 2.97 | 2.64 | 2.29 | 1.81 | 2.6 | 2.6 | 2.6 | 2.6 | 2.6 |
| EBIT | 165.2 | 234.2 | 187.8 | 147.2 | 193.6 | 330.0 | 393.8 | 469.8 | 560.6 | 668.9 |
| EBIT, % | 2.96 | 3.5 | 2.43 | 1.67 | 1.72 | 2.46 | 2.46 | 2.46 | 2.46 | 2.46 |
| Total Cash | 262.0 | 46.7 | 13.6 | 13.1 | 61.3 | 168.3 | 200.8 | 239.6 | 285.9 | 341.2 |
| Total Cash, percent | .0 | .0 | .0 | .0 | .0 | .0 | .0 | .0 | .0 | .0 |
| Account Receivables | 700.8 | 805.0 | 868.4 | 1,010.8 | 1,149.1 | 1,545.3 | 1,843.7 | 2,199.9 | 2,624.8 | 3,131.8 |
| Account Receivables, % | 12.56 | 12.02 | 11.25 | 11.45 | 10.2 | 11.5 | 11.5 | 11.5 | 11.5 | 11.5 |
| Inventories | 300.1 | 299.2 | 430.5 | 402.8 | 640.6 | 690.1 | 823.4 | 982.5 | 1,172.3 | 1,398.7 |
| Inventories, % | 5.38 | 4.47 | 5.58 | 4.56 | 5.69 | 5.13 | 5.13 | 5.13 | 5.13 | 5.13 |
| Accounts Payable | 355.8 | 408.1 | 526.9 | 641.6 | 941.3 | 938.8 | 1,120.1 | 1,336.4 | 1,594.6 | 1,902.6 |
| Accounts Payable, % | 6.38 | 6.09 | 6.82 | 7.27 | 8.35 | 6.98 | 6.98 | 6.98 | 6.98 | 6.98 |
| Capital Expenditure | -51.9 | -59.3 | -70.1 | -73.5 | -80.9 | -114.9 | -137.1 | -163.6 | -195.2 | -232.9 |
| Capital Expenditure, % | -0.93019 | -0.88488 | -0.90813 | -0.83306 | -0.71818 | -0.85489 | -0.85489 | -0.85489 | -0.85489 | -0.85489 |
| Tax Rate, % | 48.01 | 48.01 | 48.01 | 48.01 | 48.01 | 48.01 | 48.01 | 48.01 | 48.01 | 48.01 |
| EBITAT | 131.0 | 169.4 | 221.3 | 128.3 | 100.7 | 257.9 | 307.8 | 367.2 | 438.1 | 522.8 |
| Depreciation | ||||||||||
| Changes in Account Receivables | ||||||||||
| Changes in Inventories | ||||||||||
| Changes in Accounts Payable | ||||||||||
| Capital Expenditure | ||||||||||
| UFCF | -384.5 | 258.3 | 279.3 | 257.1 | 147.8 | 43.6 | 336.4 | 401.4 | 478.9 | 571.4 |
| WACC, % | 12.05 | 11.86 | 12.62 | 12.27 | 11.31 | 12.02 | 12.02 | 12.02 | 12.02 | 12.02 |
| PV UFCF | ||||||||||
| SUM PV UFCF | 1,220.6 | |||||||||
| Long Term Growth Rate, % | 2.00 | |||||||||
| Free cash flow (T + 1) | 583 | |||||||||
| Terminal Value | 5,816 | |||||||||
| Present Terminal Value | 3,297 | |||||||||
| Enterprise Value | 4,517 | |||||||||
| Net Debt | 2,844 | |||||||||
| Equity Value | 1,674 | |||||||||
| Diluted Shares Outstanding, MM | 193 | |||||||||
| Equity Value Per Share | 8.67 |
What You'll Receive
- Authentic BrightSpring Data: Preloaded financial information – from revenue to EBIT – based on actual and projected metrics.
- Comprehensive Customization: Modify all key parameters (yellow cells) such as WACC, growth %, and tax rates.
- Immediate Valuation Adjustments: Automatic recalculations to assess the effects of changes on BrightSpring's fair value.
- Flexible Excel Template: Designed for quick modifications, scenario analysis, and detailed forecast modeling.
- Efficient and Precise: Avoid building models from the ground up while ensuring accuracy and adaptability.
Core Benefits
- Customizable Forecast Inputs: Adjust essential metrics such as patient growth, service expansion costs, and operational expenditures.
- Instant DCF Valuation: Quickly computes intrinsic value, net present value (NPV), and additional financial metrics.
- High-Precision Accuracy: Leverages BrightSpring's actual financial data for credible valuation results.
- Simplified Scenario Analysis: Easily evaluate various assumptions and assess results side by side.
- Efficiency Booster: Removes the necessity for constructing intricate valuation models from the ground up.
How It Functions
- Step 1: Download the Excel spreadsheet.
- Step 2: Examine the pre-filled data for BrightSpring Health Services, Inc. (BTSG) (historical and projected).
- Step 3: Modify the key assumptions (highlighted in yellow) according to your insights.
- Step 4: Observe the automatic updates for BrightSpring’s intrinsic value.
- Step 5: Utilize the results for your investment strategies or reporting needs.
Why Opt for This Calculator?
- User-Friendly Interface: Crafted to cater to both novices and experienced users.
- Customizable Inputs: Easily adjust parameters to suit your specific analysis.
- Real-Time Updates: Observe immediate changes to BrightSpring Health Services, Inc.'s (BTSG) valuation as you tweak the inputs.
- Preloaded Data: Comes equipped with BrightSpring’s actual financial information for fast assessments.
- Preferred by Experts: Employed by investors and analysts to drive informed decision-making.
Who Can Benefit from This Service?
- Investors: Assess the valuation of BrightSpring Health Services, Inc. (BTSG) prior to making investment decisions.
- Chief Financial Officers and Analysts: Optimize valuation workflows and evaluate financial forecasts.
- Startup Founders: Understand the valuation methodologies used for established companies like BrightSpring Health Services, Inc. (BTSG).
- Consultants: Create detailed valuation reports for their clients based on BrightSpring Health Services, Inc. (BTSG).
- Students and Educators: Utilize current market data to learn and teach valuation strategies effectively.
Contents of the Template
- Pre-Filled Data: Contains BrightSpring Health Services, Inc.'s historical financial performance and projections.
- Discounted Cash Flow Model: An editable DCF valuation model with automated calculations.
- Weighted Average Cost of Capital (WACC): A separate worksheet for calculating WACC based on user-defined inputs.
- Key Financial Ratios: Evaluate the profitability, efficiency, and leverage of BrightSpring Health Services, Inc. (BTSG).
- Customizable Inputs: Easily modify revenue growth rates, margins, and tax rates.
- User-Friendly Dashboard: Visualizations and tables highlighting essential valuation outcomes.
Disclaimer
All information, articles, and product details provided on this website are for general informational and educational purposes only. We do not claim any ownership over, nor do we intend to infringe upon, any trademarks, copyrights, logos, brand names, or other intellectual property mentioned or depicted on this site. Such intellectual property remains the property of its respective owners, and any references here are made solely for identification or informational purposes, without implying any affiliation, endorsement, or partnership.
We make no representations or warranties, express or implied, regarding the accuracy, completeness, or suitability of any content or products presented. Nothing on this website should be construed as legal, tax, investment, financial, medical, or other professional advice. In addition, no part of this site—including articles or product references—constitutes a solicitation, recommendation, endorsement, advertisement, or offer to buy or sell any securities, franchises, or other financial instruments, particularly in jurisdictions where such activity would be unlawful.
All content is of a general nature and may not address the specific circumstances of any individual or entity. It is not a substitute for professional advice or services. Any actions you take based on the information provided here are strictly at your own risk. You accept full responsibility for any decisions or outcomes arising from your use of this website and agree to release us from any liability in connection with your use of, or reliance upon, the content or products found herein.