
|
Cadiz Inc. (CDZI) DCF تقييم |
Fully Editable: Tailor To Your Needs In Excel Or Sheets
Professional Design: Trusted, Industry-Standard Templates
Investor-Approved Valuation Models
MAC/PC Compatible, Fully Unlocked
No Expertise Is Needed; Easy To Follow
Cadiz Inc. (CDZI) Bundle
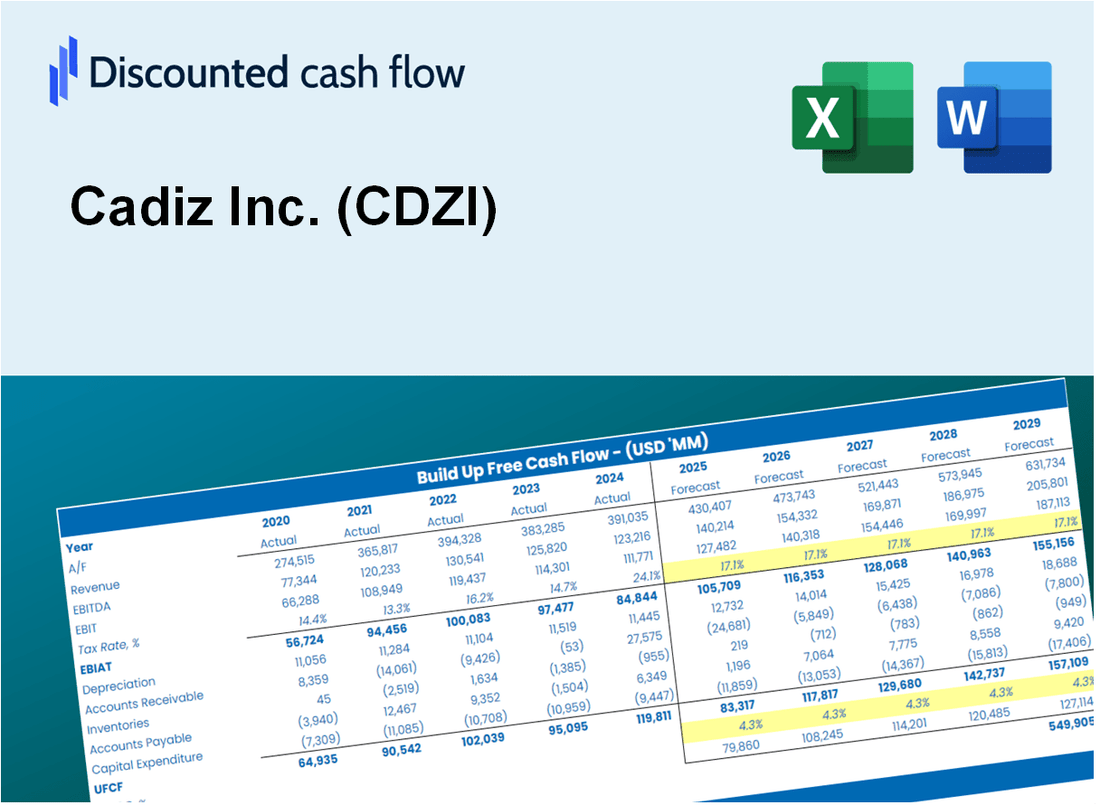
اكتسب نظرة ثاقبة على Cadiz Inc. تحليل التقييم (CDZI) باستخدام حاسبة DCF المتطورة! يأتي نموذج Excel هذا محملاً مسبقًا ببيانات حقيقية لـ (CDZI)، مما يتيح لك ضبط التوقعات والافتراضات لتحديد القيمة الجوهرية لشركة Cadiz Inc بدقة.
What You Will Get
- Real CDZI Financials: Access to historical and projected data for precise valuation.
- Customizable Inputs: Adjust WACC, tax rates, revenue growth, and capital expenditures as needed.
- Dynamic Calculations: Intrinsic value and NPV are computed automatically.
- Scenario Analysis: Explore various scenarios to assess Cadiz Inc.'s future performance.
- User-Friendly Design: Designed for professionals while remaining approachable for newcomers.
Key Features
- Comprehensive Cadiz Financials: Gain access to precise pre-loaded historical data and future forecasts.
- Adjustable Forecast Inputs: Modify highlighted cells such as WACC, growth rates, and profit margins.
- Real-Time Calculations: Automatic updates to DCF, Net Present Value (NPV), and cash flow evaluations.
- Interactive Dashboard: User-friendly charts and summaries to help visualize your valuation outcomes.
- Designed for All Skill Levels: An intuitive layout tailored for investors, CFOs, and consultants alike.
How It Works
- Step 1: Download the Excel file.
- Step 2: Review pre-entered Cadiz Inc. (CDZI) data (historical and projected).
- Step 3: Adjust key assumptions (yellow cells) based on your analysis.
- Step 4: View automatic recalculations for Cadiz Inc.'s intrinsic value.
- Step 5: Use the outputs for investment decisions or reporting.
Why Choose This Calculator for Cadiz Inc. (CDZI)?
- Designed for Experts: A sophisticated tool tailored for analysts, CFOs, and financial consultants.
- Accurate Data: Cadiz Inc.'s historical and projected financial information is preloaded for precise calculations.
- Flexible Scenario Analysis: Effortlessly test various forecasts and assumptions to gauge potential outcomes.
- Comprehensive Outputs: Automatically computes intrinsic value, NPV, and essential financial metrics.
- User-Friendly: Step-by-step guidance ensures a smooth and straightforward experience.
Who Should Use This Product?
- Individual Investors: Gain insights to make informed decisions about buying or selling Cadiz Inc. (CDZI) stock.
- Financial Analysts: Enhance valuation processes with comprehensive financial models tailored for Cadiz Inc. (CDZI).
- Consultants: Provide clients with accurate and timely valuation insights on Cadiz Inc. (CDZI).
- Business Owners: Learn from the valuation strategies of Cadiz Inc. (CDZI) to inform your own business decisions.
- Finance Students: Explore valuation methodologies using real data from Cadiz Inc. (CDZI) to support your studies.
What the Template Contains
- Pre-Filled DCF Model: Cadiz Inc.'s (CDZI) financial data preloaded for immediate use.
- WACC Calculator: Detailed calculations for Weighted Average Cost of Capital.
- Financial Ratios: Evaluate Cadiz Inc.'s (CDZI) profitability, leverage, and efficiency.
- Editable Inputs: Change assumptions such as growth, margins, and CAPEX to fit your scenarios.
- Financial Statements: Annual and quarterly reports to support detailed analysis.
- Interactive Dashboard: Easily visualize key valuation metrics and results.
Disclaimer
All information, articles, and product details provided on this website are for general informational and educational purposes only. We do not claim any ownership over, nor do we intend to infringe upon, any trademarks, copyrights, logos, brand names, or other intellectual property mentioned or depicted on this site. Such intellectual property remains the property of its respective owners, and any references here are made solely for identification or informational purposes, without implying any affiliation, endorsement, or partnership.
We make no representations or warranties, express or implied, regarding the accuracy, completeness, or suitability of any content or products presented. Nothing on this website should be construed as legal, tax, investment, financial, medical, or other professional advice. In addition, no part of this site—including articles or product references—constitutes a solicitation, recommendation, endorsement, advertisement, or offer to buy or sell any securities, franchises, or other financial instruments, particularly in jurisdictions where such activity would be unlawful.
All content is of a general nature and may not address the specific circumstances of any individual or entity. It is not a substitute for professional advice or services. Any actions you take based on the information provided here are strictly at your own risk. You accept full responsibility for any decisions or outcomes arising from your use of this website and agree to release us from any liability in connection with your use of, or reliance upon, the content or products found herein.