
|
Cie Automotive India Limited (Cieindia.ns) تقييم DCF |
Fully Editable: Tailor To Your Needs In Excel Or Sheets
Professional Design: Trusted, Industry-Standard Templates
Investor-Approved Valuation Models
MAC/PC Compatible, Fully Unlocked
No Expertise Is Needed; Easy To Follow
CIE Automotive India Limited (CIEINDIA.NS) Bundle
اكتشف الإمكانات الحقيقية لـ CIE Automotive India Limited مع حاسبة DCF الخاصة بنا! اضبط الافتراضات الهامة واستكشاف السيناريوهات المختلفة وتقييم كيفية تأثير التغييرات على تقييم CIE Automotive India Limited - كل ذلك ضمن قالب Excel واحد.
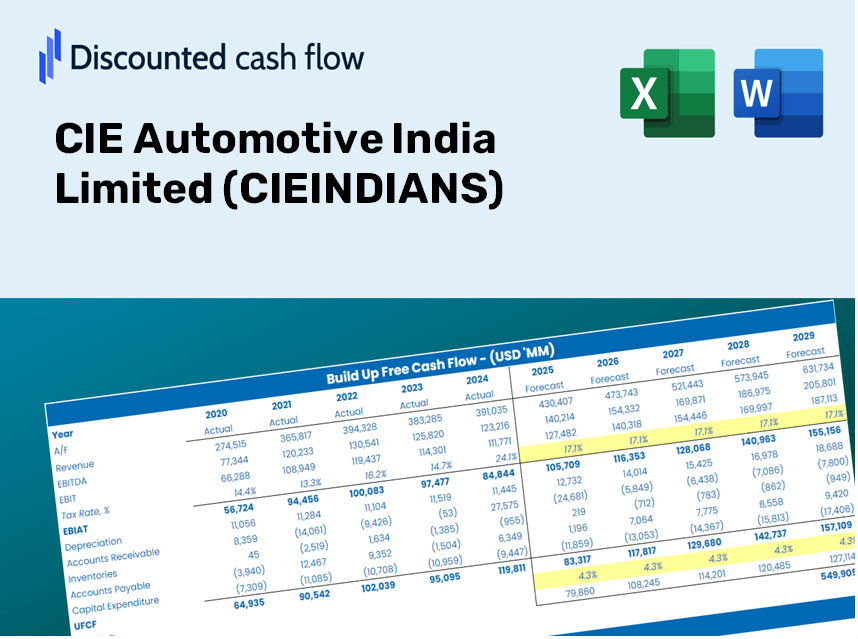
Discounted Cash Flow (DCF) - (USD MM)
| Year | AY1 2020 |
AY2 2021 |
AY3 2022 |
AY4 2023 |
AY5 2024 |
FY1 2025 |
FY2 2026 |
FY3 2027 |
FY4 2028 |
FY5 2029 |
|---|---|---|---|---|---|---|---|---|---|---|
| Revenue | 60,501.0 | 67,651.0 | 87,530.4 | 92,803.5 | 89,640.7 | 99,460.7 | 110,356.4 | 122,445.8 | 135,859.6 | 150,742.8 |
| Revenue Growth, % | 0 | 11.82 | 29.39 | 6.02 | -3.41 | 10.95 | 10.95 | 10.95 | 10.95 | 10.95 |
| EBITDA | 4,853.0 | 10,111.0 | 10,231.2 | 14,246.7 | 13,999.0 | 13,054.0 | 14,484.1 | 16,070.8 | 17,831.3 | 19,784.7 |
| EBITDA, % | 8.02 | 14.95 | 11.69 | 15.35 | 15.62 | 13.12 | 13.12 | 13.12 | 13.12 | 13.12 |
| Depreciation | 2,642.0 | 3,047.0 | 1,104.0 | 2,979.6 | 3,050.2 | 3,331.0 | 3,695.9 | 4,100.8 | 4,550.1 | 5,048.5 |
| Depreciation, % | 4.37 | 4.5 | 1.26 | 3.21 | 3.4 | 3.35 | 3.35 | 3.35 | 3.35 | 3.35 |
| EBIT | 2,211.0 | 7,064.0 | 9,127.2 | 11,267.2 | 10,948.8 | 9,723.0 | 10,788.2 | 11,970.0 | 13,281.3 | 14,736.2 |
| EBIT, % | 3.65 | 10.44 | 10.43 | 12.14 | 12.21 | 9.78 | 9.78 | 9.78 | 9.78 | 9.78 |
| Total Cash | 5,219.0 | 5,736.0 | 6,276.0 | 9,936.7 | 12,922.2 | 9,826.3 | 10,902.8 | 12,097.2 | 13,422.4 | 14,892.8 |
| Total Cash, percent | .0 | .0 | .0 | .0 | .0 | .0 | .0 | .0 | .0 | .0 |
| Account Receivables | 8,200.0 | 7,702.0 | 9,714.0 | 7,922.3 | 9,088.1 | 10,883.2 | 12,075.5 | 13,398.3 | 14,866.1 | 16,494.6 |
| Account Receivables, % | 13.55 | 11.38 | 11.1 | 8.54 | 10.14 | 10.94 | 10.94 | 10.94 | 10.94 | 10.94 |
| Inventories | 10,062.0 | 13,486.0 | 12,108.0 | 11,626.1 | 10,910.7 | 14,938.6 | 16,575.1 | 18,390.8 | 20,405.5 | 22,640.9 |
| Inventories, % | 16.63 | 19.93 | 13.83 | 12.53 | 12.17 | 15.02 | 15.02 | 15.02 | 15.02 | 15.02 |
| Accounts Payable | 14,590.0 | 19,385.0 | 21,349.9 | 19,341.1 | 15,809.2 | 23,002.9 | 25,522.9 | 28,318.9 | 31,421.1 | 34,863.3 |
| Accounts Payable, % | 24.12 | 28.65 | 24.39 | 20.84 | 17.64 | 23.13 | 23.13 | 23.13 | 23.13 | 23.13 |
| Capital Expenditure | -3,343.0 | -5,267.0 | -5,014.0 | -5,303.2 | -3,866.6 | -5,782.1 | -6,415.5 | -7,118.3 | -7,898.1 | -8,763.3 |
| Capital Expenditure, % | -5.53 | -7.79 | -5.73 | -5.71 | -4.31 | -5.81 | -5.81 | -5.81 | -5.81 | -5.81 |
| Tax Rate, % | 23.71 | 23.71 | 23.71 | 23.71 | 23.71 | 23.71 | 23.71 | 23.71 | 23.71 | 23.71 |
| EBITAT | 1,204.6 | 4,150.5 | -1,306.2 | 11,783.4 | 8,353.0 | 5,630.2 | 6,246.9 | 6,931.3 | 7,690.6 | 8,533.1 |
| Depreciation | ||||||||||
| Changes in Account Receivables | ||||||||||
| Changes in Inventories | ||||||||||
| Changes in Accounts Payable | ||||||||||
| Capital Expenditure | ||||||||||
| UFCF | -3,168.4 | 3,799.5 | -3,885.4 | 9,724.8 | 3,554.3 | 4,549.8 | 3,218.6 | 3,571.2 | 3,962.4 | 4,396.5 |
| WACC, % | 4.75 | 4.77 | 4.5 | 4.96 | 4.85 | 4.76 | 4.76 | 4.76 | 4.76 | 4.76 |
| PV UFCF | ||||||||||
| SUM PV UFCF | 17,154.7 | |||||||||
| Long Term Growth Rate, % | 3.50 | |||||||||
| Free cash flow (T + 1) | 4,550 | |||||||||
| Terminal Value | 360,289 | |||||||||
| Present Terminal Value | 285,504 | |||||||||
| Enterprise Value | 302,658 | |||||||||
| Net Debt | 2,691 | |||||||||
| Equity Value | 299,968 | |||||||||
| Diluted Shares Outstanding, MM | 379 | |||||||||
| Equity Value Per Share | 790.72 |
ما ستتلقاه
- البيانات المالية Cieindians الحقيقية: مليئة بالبيانات التاريخية والمتوقعة لـ CIE Automotive India Limited للتحليل الدقيق.
- قالب قابل للتخصيص تمامًا: بسهولة ضبط المدخلات الرئيسية مثل نمو الإيرادات و WACC و EBITDA ٪.
- الحسابات الفورية: شاهد تحديث القيمة الجوهرية لـ Cieindians في الوقت الفعلي أثناء إجراء تغييرات.
- أداة التقييم المهنية: مصمم للمستثمرين والمحللين والمستشارين الذين يهدفون إلى نتائج DCF دقيقة.
- تنسيق سهل الاستخدام: تم تصميمه بتخطيط مباشر وإرشادات واضحة مناسبة لجميع مستويات المهارة.
الميزات الرئيسية
- البيانات التي تم تحميلها مسبقًا: CIE Automotive India Limited البيانات المالية التاريخية والتنبؤات المليئة مسبقًا.
- مدخلات قابلة للتعديل بالكامل: تعديل WACC ، ومعدلات الضرائب ، ونمو الإيرادات ، وهامش EBITDA حسب الحاجة.
- النتائج الفورية: مراقبة CIE Automotive India Limited القيمة الجوهرية التي تعيد حسابها في الوقت الفعلي.
- واضحة المخرجات المرئية: تقدم مخططات لوحة القيادة نتائج التقييم والمقاييس المهمة.
- بنيت للدقة: أداة من الدرجة المهنية المصممة للمحللين والمستثمرين والمهنيين الماليين.
كيف تعمل
- الخطوة 1: قم بتنزيل جدول بيانات Excel.
- الخطوة 2: فحص البيانات المليئة مسبقًا بـ CIE Automotive India Limited (Cieindians) (التاريخية والمتوقعة).
- الخطوة 3: تعديل الافتراضات الرئيسية (المبرمة باللون الأصفر) وفقا لتحليلك.
- الخطوة 4: راقب التحديثات التلقائية للقيمة الجوهرية لـ CIE Automotive India Limited (Cieindians).
- الخطوة 5: الاستفادة من نتائج قرارات الاستثمار أو أغراض الإبلاغ.
لماذا تختار هذه الآلة الحاسبة لـ CIE Automotive India Limited (Cieindians)؟
- مصمم للخبراء: أداة متطورة يفضلها المحللون والمدير المالي والمستشارون في الصناعة.
- بيانات مالية دقيقة: يتم تحميل البيانات المالية التاريخية والمتوقعة في CIE Automotive India لنتائج موثوقة.
- تحليل السيناريو المرن: اختبار دون عناء التنبؤات والافتراضات.
- مخرجات شاملة: الحسابات الفورية للقيمة الجوهرية ، NPV ، والمقاييس الحرجة.
- سهل الاستخدام: يضمن التوجيه خطوة بخطوة تجربة سلسة.
من يجب أن يستخدم هذا المنتج؟
- المستثمرين المحترفين: قم بإنشاء نماذج تقييم شاملة وجديرة بالثقة لتقييمات المحفظة المتعلقة بـ CIE Automotive India Limited (Cieindians).
- فرق تمويل الشركات: تقييم سيناريوهات التقييم لإبلاغ القرارات الاستراتيجية داخل المنظمة.
- الاستشاريون والمستشارون: قدم للعملاء رؤى تقييم دقيقة تتعلق بـ CIE Automotive India Limited (Cieindians).
- الطلاب والمعلمين: الاستفادة من البيانات في الوقت الفعلي لتعزيز التعلم والممارسة في النمذجة المالية.
- عشاق الصناعة: اكتساب رؤى حول كيفية تقييم شركات مثل Cie Automotive India Limited (Cieindians) في السوق.
مكونات القالب
- بيانات Cieindians المسبقة: الأرقام المالية التاريخية والمتوقعة ، والتي تشمل الإيرادات ، والوزارة الداخلية ، والنفقات الرأسمالية.
- نماذج DCF و WACC: جداول البيانات المتقدمة المصممة لحساب القيمة الجوهرية ومتوسط تكلفة رأس المال المرجح.
- مدخلات قابلة للتخصيص: الخلايا المرتفعة الصفراء لتعديل نمو الإيرادات ومعدلات الضرائب ومعدلات الخصم.
- البيانات المالية: تقارير مالية سنوية وفصلية مفصلة للتحليل المتعمق.
- النسب الرئيسية: المقاييس المتعلقة بالربحية والرافعة المالية والكفاءة لتقييم الأداء.
- لوحة القيادة والمخططات: التمثيل المرئي لنتائج التقييم والافتراضات الأساسية.
Disclaimer
All information, articles, and product details provided on this website are for general informational and educational purposes only. We do not claim any ownership over, nor do we intend to infringe upon, any trademarks, copyrights, logos, brand names, or other intellectual property mentioned or depicted on this site. Such intellectual property remains the property of its respective owners, and any references here are made solely for identification or informational purposes, without implying any affiliation, endorsement, or partnership.
We make no representations or warranties, express or implied, regarding the accuracy, completeness, or suitability of any content or products presented. Nothing on this website should be construed as legal, tax, investment, financial, medical, or other professional advice. In addition, no part of this site—including articles or product references—constitutes a solicitation, recommendation, endorsement, advertisement, or offer to buy or sell any securities, franchises, or other financial instruments, particularly in jurisdictions where such activity would be unlawful.
All content is of a general nature and may not address the specific circumstances of any individual or entity. It is not a substitute for professional advice or services. Any actions you take based on the information provided here are strictly at your own risk. You accept full responsibility for any decisions or outcomes arising from your use of this website and agree to release us from any liability in connection with your use of, or reliance upon, the content or products found herein.