
|
CIE Automotive India Limited (Cieindia.NS) Avaliação DCF |
Totalmente Editável: Adapte-Se Às Suas Necessidades No Excel Ou Planilhas
Design Profissional: Modelos Confiáveis E Padrão Da Indústria
Pré-Construídos Para Uso Rápido E Eficiente
Compatível com MAC/PC, totalmente desbloqueado
Não É Necessária Experiência; Fácil De Seguir
CIE Automotive India Limited (CIEINDIA.NS) Bundle
Descubra o verdadeiro potencial da CIE Automotive India Limited com nossa calculadora DCF premium! Ajuste as suposições críticas, explore vários cenários e avalie como as mudanças afetam a avaliação da CIE Automotive India Limited - tudo dentro de um único modelo do Excel.
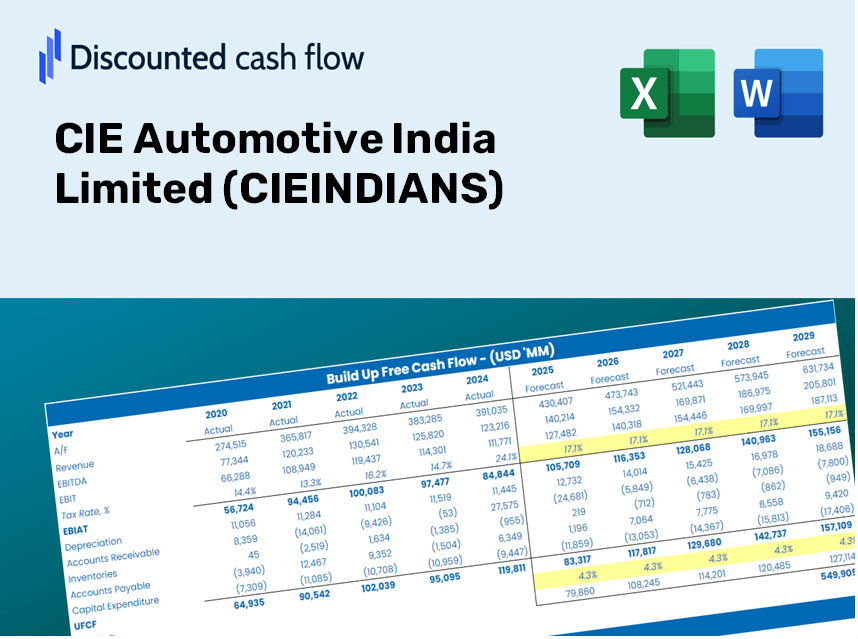
Discounted Cash Flow (DCF) - (USD MM)
| Year | AY1 2020 |
AY2 2021 |
AY3 2022 |
AY4 2023 |
AY5 2024 |
FY1 2025 |
FY2 2026 |
FY3 2027 |
FY4 2028 |
FY5 2029 |
|---|---|---|---|---|---|---|---|---|---|---|
| Revenue | 60,501.0 | 67,651.0 | 87,530.4 | 92,803.5 | 89,640.7 | 99,460.7 | 110,356.4 | 122,445.8 | 135,859.6 | 150,742.8 |
| Revenue Growth, % | 0 | 11.82 | 29.39 | 6.02 | -3.41 | 10.95 | 10.95 | 10.95 | 10.95 | 10.95 |
| EBITDA | 4,853.0 | 10,111.0 | 10,231.2 | 14,246.7 | 13,999.0 | 13,054.0 | 14,484.1 | 16,070.8 | 17,831.3 | 19,784.7 |
| EBITDA, % | 8.02 | 14.95 | 11.69 | 15.35 | 15.62 | 13.12 | 13.12 | 13.12 | 13.12 | 13.12 |
| Depreciation | 2,642.0 | 3,047.0 | 1,104.0 | 2,979.6 | 3,050.2 | 3,331.0 | 3,695.9 | 4,100.8 | 4,550.1 | 5,048.5 |
| Depreciation, % | 4.37 | 4.5 | 1.26 | 3.21 | 3.4 | 3.35 | 3.35 | 3.35 | 3.35 | 3.35 |
| EBIT | 2,211.0 | 7,064.0 | 9,127.2 | 11,267.2 | 10,948.8 | 9,723.0 | 10,788.2 | 11,970.0 | 13,281.3 | 14,736.2 |
| EBIT, % | 3.65 | 10.44 | 10.43 | 12.14 | 12.21 | 9.78 | 9.78 | 9.78 | 9.78 | 9.78 |
| Total Cash | 5,219.0 | 5,736.0 | 6,276.0 | 9,936.7 | 12,922.2 | 9,826.3 | 10,902.8 | 12,097.2 | 13,422.4 | 14,892.8 |
| Total Cash, percent | .0 | .0 | .0 | .0 | .0 | .0 | .0 | .0 | .0 | .0 |
| Account Receivables | 8,200.0 | 7,702.0 | 9,714.0 | 7,922.3 | 9,088.1 | 10,883.2 | 12,075.5 | 13,398.3 | 14,866.1 | 16,494.6 |
| Account Receivables, % | 13.55 | 11.38 | 11.1 | 8.54 | 10.14 | 10.94 | 10.94 | 10.94 | 10.94 | 10.94 |
| Inventories | 10,062.0 | 13,486.0 | 12,108.0 | 11,626.1 | 10,910.7 | 14,938.6 | 16,575.1 | 18,390.8 | 20,405.5 | 22,640.9 |
| Inventories, % | 16.63 | 19.93 | 13.83 | 12.53 | 12.17 | 15.02 | 15.02 | 15.02 | 15.02 | 15.02 |
| Accounts Payable | 14,590.0 | 19,385.0 | 21,349.9 | 19,341.1 | 15,809.2 | 23,002.9 | 25,522.9 | 28,318.9 | 31,421.1 | 34,863.3 |
| Accounts Payable, % | 24.12 | 28.65 | 24.39 | 20.84 | 17.64 | 23.13 | 23.13 | 23.13 | 23.13 | 23.13 |
| Capital Expenditure | -3,343.0 | -5,267.0 | -5,014.0 | -5,303.2 | -3,866.6 | -5,782.1 | -6,415.5 | -7,118.3 | -7,898.1 | -8,763.3 |
| Capital Expenditure, % | -5.53 | -7.79 | -5.73 | -5.71 | -4.31 | -5.81 | -5.81 | -5.81 | -5.81 | -5.81 |
| Tax Rate, % | 23.71 | 23.71 | 23.71 | 23.71 | 23.71 | 23.71 | 23.71 | 23.71 | 23.71 | 23.71 |
| EBITAT | 1,204.6 | 4,150.5 | -1,306.2 | 11,783.4 | 8,353.0 | 5,630.2 | 6,246.9 | 6,931.3 | 7,690.6 | 8,533.1 |
| Depreciation | ||||||||||
| Changes in Account Receivables | ||||||||||
| Changes in Inventories | ||||||||||
| Changes in Accounts Payable | ||||||||||
| Capital Expenditure | ||||||||||
| UFCF | -3,168.4 | 3,799.5 | -3,885.4 | 9,724.8 | 3,554.3 | 4,549.8 | 3,218.6 | 3,571.2 | 3,962.4 | 4,396.5 |
| WACC, % | 4.75 | 4.77 | 4.5 | 4.96 | 4.85 | 4.76 | 4.76 | 4.76 | 4.76 | 4.76 |
| PV UFCF | ||||||||||
| SUM PV UFCF | 17,154.7 | |||||||||
| Long Term Growth Rate, % | 3.50 | |||||||||
| Free cash flow (T + 1) | 4,550 | |||||||||
| Terminal Value | 360,289 | |||||||||
| Present Terminal Value | 285,504 | |||||||||
| Enterprise Value | 302,658 | |||||||||
| Net Debt | 2,691 | |||||||||
| Equity Value | 299,968 | |||||||||
| Diluted Shares Outstanding, MM | 379 | |||||||||
| Equity Value Per Share | 790.72 |
What You'll Receive
- Real CIEINDIANS Financial Data: Pre-filled with CIE Automotive India Limited’s historical and projected data for accurate analysis.
- Completely Customizable Template: Easily adjust key inputs such as revenue growth, WACC, and EBITDA %.
- Instant Calculations: Watch CIEINDIANS' intrinsic value update in real-time as you make changes.
- Professional Valuation Tool: Tailored for investors, analysts, and consultants aiming for precise DCF outcomes.
- User-Friendly Format: Designed with a straightforward layout and clear guidance suitable for all skill levels.
Key Features
- Pre-Loaded Data: CIE Automotive India Limited’s historical financial statements and pre-filled forecasts.
- Fully Adjustable Inputs: Modify WACC, tax rates, revenue growth, and EBITDA margins as needed.
- Instant Results: Monitor CIE Automotive India Limited’s intrinsic value recalculating in real time.
- Clear Visual Outputs: Dashboard charts present valuation results and important metrics.
- Built for Accuracy: A professional-grade tool designed for analysts, investors, and finance professionals.
How It Functions
- Step 1: Download the Excel spreadsheet.
- Step 2: Examine the pre-filled data for CIE Automotive India Limited (CIEINDIANS) (historical and projected).
- Step 3: Modify key assumptions (highlighted in yellow) according to your analysis.
- Step 4: Observe automatic updates for the intrinsic value of CIE Automotive India Limited (CIEINDIANS).
- Step 5: Utilize the results for investment decisions or reporting purposes.
Why Choose This Calculator for CIE Automotive India Limited (CIEINDIANS)?
- Designed for Experts: A sophisticated tool favored by analysts, CFOs, and industry consultants.
- Accurate Financial Data: CIE Automotive India's historical and projected financials are preloaded for reliable results.
- Flexible Scenario Analysis: Effortlessly test various forecasts and assumptions.
- Comprehensive Outputs: Instant calculations of intrinsic value, NPV, and critical metrics.
- User-Friendly: Step-by-step guidance ensures a smooth experience.
Who Should Utilize This Product?
- Professional Investors: Create comprehensive and trustworthy valuation models for portfolio assessments related to CIE Automotive India Limited (CIEINDIANS).
- Corporate Finance Teams: Evaluate valuation scenarios to inform strategic decisions within the organization.
- Consultants and Advisors: Offer clients precise valuation insights pertaining to CIE Automotive India Limited (CIEINDIANS).
- Students and Educators: Leverage real-time data to enhance learning and practice in financial modeling.
- Industry Enthusiasts: Gain insights into how companies like CIE Automotive India Limited (CIEINDIANS) are appraised in the marketplace.
Components of the Template
- Preloaded CIEINDIANS Data: Historical and forecasted financial figures, encompassing revenue, EBIT, and capital expenditures.
- DCF and WACC Models: Advanced spreadsheets designed for calculating intrinsic value and Weighted Average Cost of Capital.
- Customizable Inputs: Yellow-highlighted cells for modifying revenue growth, tax rates, and discount rates.
- Financial Statements: Detailed annual and quarterly financial reports for in-depth analysis.
- Key Ratios: Metrics related to profitability, leverage, and efficiency for performance assessment.
- Dashboard and Charts: Visual representations of valuation results and underlying assumptions.
Disclaimer
All information, articles, and product details provided on this website are for general informational and educational purposes only. We do not claim any ownership over, nor do we intend to infringe upon, any trademarks, copyrights, logos, brand names, or other intellectual property mentioned or depicted on this site. Such intellectual property remains the property of its respective owners, and any references here are made solely for identification or informational purposes, without implying any affiliation, endorsement, or partnership.
We make no representations or warranties, express or implied, regarding the accuracy, completeness, or suitability of any content or products presented. Nothing on this website should be construed as legal, tax, investment, financial, medical, or other professional advice. In addition, no part of this site—including articles or product references—constitutes a solicitation, recommendation, endorsement, advertisement, or offer to buy or sell any securities, franchises, or other financial instruments, particularly in jurisdictions where such activity would be unlawful.
All content is of a general nature and may not address the specific circumstances of any individual or entity. It is not a substitute for professional advice or services. Any actions you take based on the information provided here are strictly at your own risk. You accept full responsibility for any decisions or outcomes arising from your use of this website and agree to release us from any liability in connection with your use of, or reliance upon, the content or products found herein.