|
تقييم Clorox (CLX) DCF |
Fully Editable: Tailor To Your Needs In Excel Or Sheets
Professional Design: Trusted, Industry-Standard Templates
Investor-Approved Valuation Models
MAC/PC Compatible, Fully Unlocked
No Expertise Is Needed; Easy To Follow
The Clorox Company (CLX) Bundle
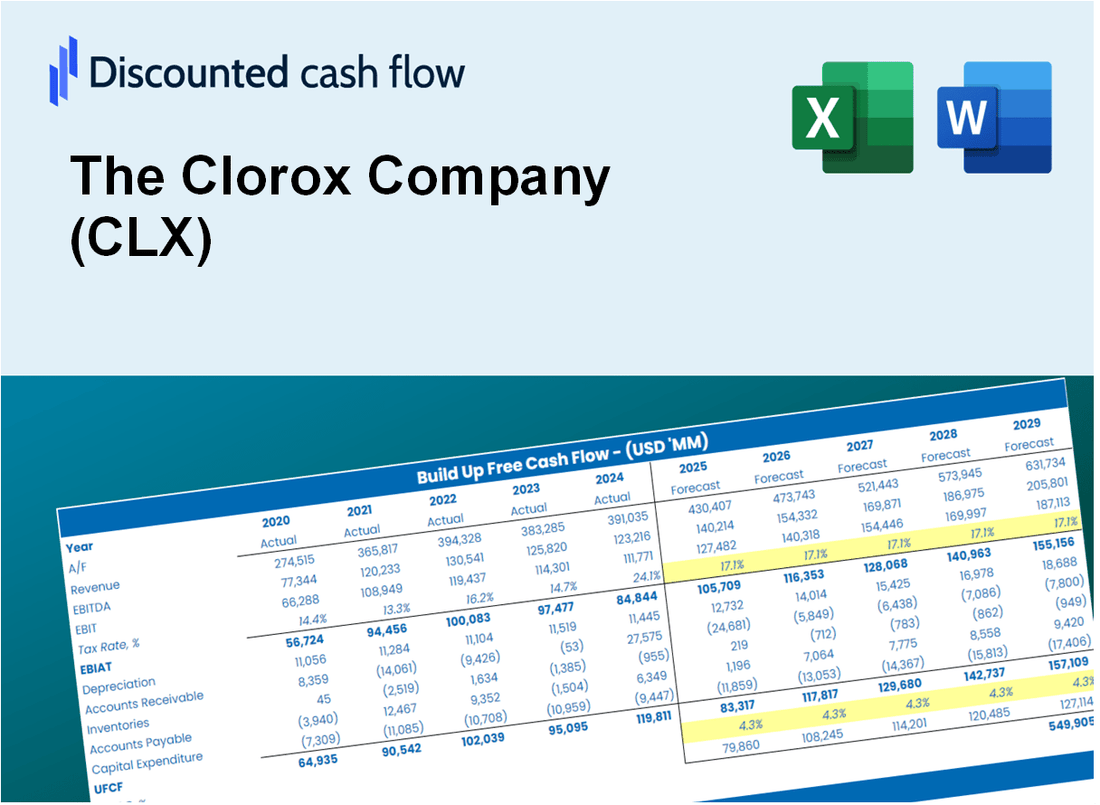
تقييم التوقعات المالية لشركة Clorox كخبير! توفر حاسبة DCF (CLX) هذه البيانات المالية المليئة مسبقًا مع تقديم مرونة كاملة لتعديل نمو الإيرادات ، WACC ، الهوامش ، وغيرها من الافتراضات الأساسية التي تتماشى مع تنبؤاتك.
What You Will Get
- Real CLX Financials: Access to historical and projected data for precise valuation.
- Adjustable Inputs: Customize WACC, tax rates, revenue growth, and capital expenditures.
- Automatic Calculations: Intrinsic value and NPV are computed in real-time.
- Scenario Analysis: Evaluate multiple scenarios to assess The Clorox Company’s future performance.
- Clear and Intuitive Design: Designed for professionals while remaining user-friendly for beginners.
Key Features
- Customizable Financial Inputs: Adjust essential parameters such as sales growth, operating margin, and capital investments.
- Instant DCF Valuation: Automatically computes intrinsic value, NPV, and other financial metrics in real-time.
- High-Quality Precision: Leverages The Clorox Company’s actual financial data for accurate valuation results.
- Effortless Scenario Analysis: Evaluate various assumptions and analyze results with ease.
- Efficiency Booster: Streamline the valuation process without the hassle of creating intricate models from the ground up.
How It Works
- Step 1: Download the prebuilt Excel template with Clorox's data included.
- Step 2: Explore the pre-filled sheets and familiarize yourself with the key metrics.
- Step 3: Update forecasts and assumptions in the editable yellow cells (WACC, growth, margins).
- Step 4: Instantly view recalculated results, including Clorox's intrinsic value.
- Step 5: Make informed investment decisions or generate reports using the outputs.
Why Choose This Calculator for The Clorox Company (CLX)?
- Accurate Data: Real Clorox financials ensure reliable valuation results.
- Customizable: Adjust key parameters such as growth rates, WACC, and tax rates to align with your forecasts.
- Time-Saving: Pre-built calculations streamline the process, saving you from starting from scratch.
- Professional-Grade Tool: Tailored for investors, analysts, and consultants in the industry.
- User-Friendly: Intuitive design and clear, step-by-step instructions make it accessible for all users.
Who Should Use This Product?
- Finance Students: Discover valuation methodologies and practice them with actual data from Clorox (CLX).
- Academics: Utilize industry-standard models for your teaching or scholarly research related to Clorox (CLX).
- Investors: Validate your investment hypotheses and evaluate valuation scenarios for Clorox (CLX) stock.
- Analysts: Enhance your analysis process with a ready-to-use, customizable DCF model tailored for Clorox (CLX).
- Small Business Owners: Understand the valuation practices used for major public companies like Clorox (CLX).
What the Template Contains
- Pre-Filled Data: Includes The Clorox Company's historical financials and forecasts.
- Discounted Cash Flow Model: Editable DCF valuation model with automatic calculations.
- Weighted Average Cost of Capital (WACC): A dedicated sheet for calculating WACC based on custom inputs.
- Key Financial Ratios: Analyze The Clorox Company's profitability, efficiency, and leverage.
- Customizable Inputs: Edit revenue growth, margins, and tax rates with ease.
- Clear Dashboard: Charts and tables summarizing key valuation results.
Disclaimer
All information, articles, and product details provided on this website are for general informational and educational purposes only. We do not claim any ownership over, nor do we intend to infringe upon, any trademarks, copyrights, logos, brand names, or other intellectual property mentioned or depicted on this site. Such intellectual property remains the property of its respective owners, and any references here are made solely for identification or informational purposes, without implying any affiliation, endorsement, or partnership.
We make no representations or warranties, express or implied, regarding the accuracy, completeness, or suitability of any content or products presented. Nothing on this website should be construed as legal, tax, investment, financial, medical, or other professional advice. In addition, no part of this site—including articles or product references—constitutes a solicitation, recommendation, endorsement, advertisement, or offer to buy or sell any securities, franchises, or other financial instruments, particularly in jurisdictions where such activity would be unlawful.
All content is of a general nature and may not address the specific circumstances of any individual or entity. It is not a substitute for professional advice or services. Any actions you take based on the information provided here are strictly at your own risk. You accept full responsibility for any decisions or outcomes arising from your use of this website and agree to release us from any liability in connection with your use of, or reliance upon, the content or products found herein.