
|
Compass ، Inc. (Comp) DCF تقييم |
Fully Editable: Tailor To Your Needs In Excel Or Sheets
Professional Design: Trusted, Industry-Standard Templates
Investor-Approved Valuation Models
MAC/PC Compatible, Fully Unlocked
No Expertise Is Needed; Easy To Follow
Compass, Inc. (COMP) Bundle
Discover Compass ، Inc. (Comp) الإمكانات الحقيقية مع حاسبة DCF المتقدمة لدينا! اضبط الافتراضات الهامة واستكشاف السيناريوهات المختلفة وتقييم كيفية تأثير التقلبات على تقييم Compass ، Inc. - كل ذلك ضمن قالب Excel شامل.
What You Will Get
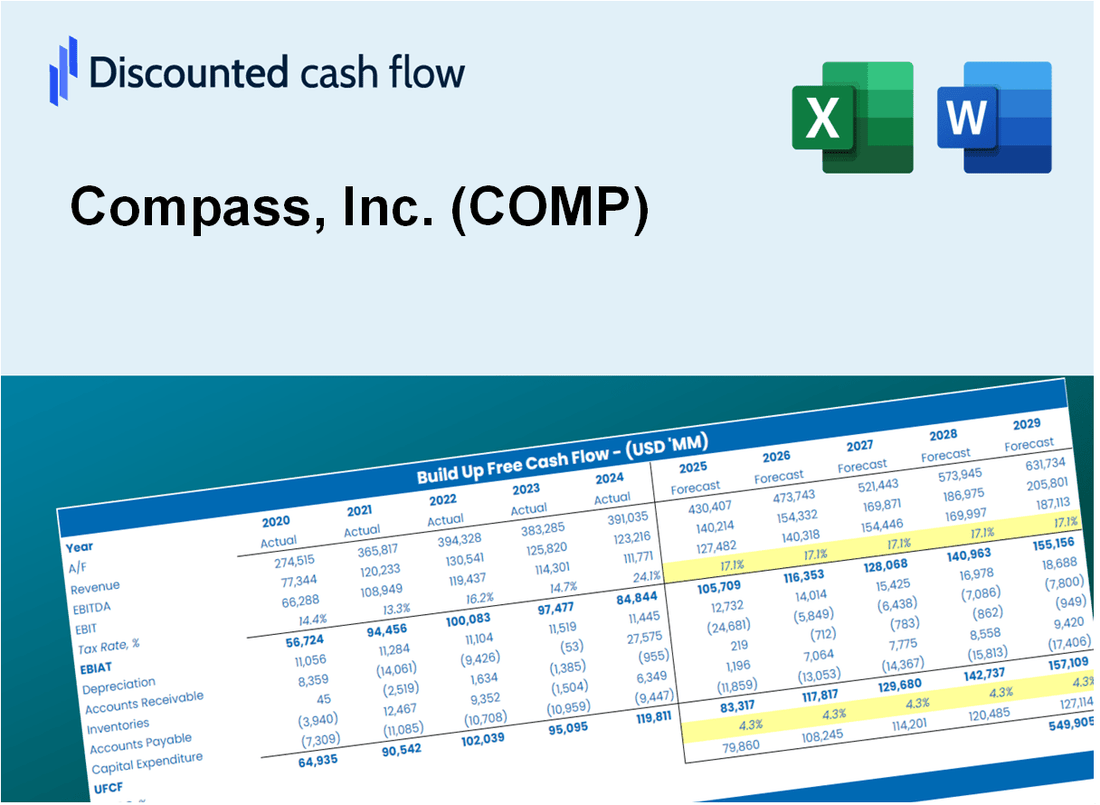
- Real COMP Financials: Access to historical and projected data for precise valuation.
- Customizable Inputs: Adjust WACC, tax rates, revenue growth, and capital expenditures as needed.
- Real-Time Calculations: Intrinsic value and NPV are computed automatically.
- Scenario Analysis: Evaluate various scenarios to assess Compass, Inc.'s future performance.
- User-Friendly Interface: Designed for professionals while remaining easy to use for newcomers.
Key Features
- Comprehensive Data: Compass, Inc.'s historical performance metrics and pre-filled projections.
- Customizable Parameters: Adjust inputs like WACC, tax rates, revenue growth, and profit margins.
- Real-Time Insights: Instantly view the intrinsic value of Compass, Inc. recalculated as you modify inputs.
- Visual Analytics: Interactive dashboard displays valuation outcomes and essential performance indicators.
- Designed for Precision: A professional-grade tool tailored for analysts, investors, and finance professionals.
How It Works
- Step 1: Download the prebuilt Excel template featuring Compass, Inc. (COMP) data.
- Step 2: Navigate through the pre-filled sheets to grasp the essential metrics.
- Step 3: Modify forecasts and assumptions in the editable yellow cells (WACC, growth, margins).
- Step 4: Instantly see the recalculated results, including Compass, Inc.'s (COMP) intrinsic value.
- Step 5: Make well-informed investment decisions or create reports based on the outputs.
Why Choose the Compass, Inc. (COMP) Calculator?
- Accuracy: Utilizes real Compass, Inc. financials for precise data.
- Flexibility: Allows users to easily test and adjust inputs as needed.
- Time-Saving: Avoid the complexity of creating a DCF model from the ground up.
- Professional-Grade: Crafted with the precision and usability expected by CFOs.
- User-Friendly: Designed for ease of use, even for those lacking advanced financial modeling skills.
Who Should Use This Product?
- Investors: Accurately assess Compass, Inc.'s (COMP) fair value prior to making investment choices.
- CFOs: Utilize a high-quality DCF model for financial reporting and analysis specific to Compass, Inc. (COMP).
- Consultants: Efficiently customize the template for valuation reports tailored to clients of Compass, Inc. (COMP).
- Entrepreneurs: Acquire knowledge of financial modeling practices employed by leading firms like Compass, Inc. (COMP).
- Educators: Implement it as a teaching resource to illustrate various valuation methodologies, including those relevant to Compass, Inc. (COMP).
What the Template Contains
- Pre-Filled DCF Model: Compass, Inc.'s (COMP) financial data preloaded for immediate use.
- WACC Calculator: Detailed calculations for Weighted Average Cost of Capital.
- Financial Ratios: Evaluate Compass, Inc.'s (COMP) profitability, leverage, and efficiency.
- Editable Inputs: Change assumptions such as growth, margins, and CAPEX to fit your scenarios.
- Financial Statements: Annual and quarterly reports to support detailed analysis.
- Interactive Dashboard: Easily visualize key valuation metrics and results.
Disclaimer
All information, articles, and product details provided on this website are for general informational and educational purposes only. We do not claim any ownership over, nor do we intend to infringe upon, any trademarks, copyrights, logos, brand names, or other intellectual property mentioned or depicted on this site. Such intellectual property remains the property of its respective owners, and any references here are made solely for identification or informational purposes, without implying any affiliation, endorsement, or partnership.
We make no representations or warranties, express or implied, regarding the accuracy, completeness, or suitability of any content or products presented. Nothing on this website should be construed as legal, tax, investment, financial, medical, or other professional advice. In addition, no part of this site—including articles or product references—constitutes a solicitation, recommendation, endorsement, advertisement, or offer to buy or sell any securities, franchises, or other financial instruments, particularly in jurisdictions where such activity would be unlawful.
All content is of a general nature and may not address the specific circumstances of any individual or entity. It is not a substitute for professional advice or services. Any actions you take based on the information provided here are strictly at your own risk. You accept full responsibility for any decisions or outcomes arising from your use of this website and agree to release us from any liability in connection with your use of, or reliance upon, the content or products found herein.